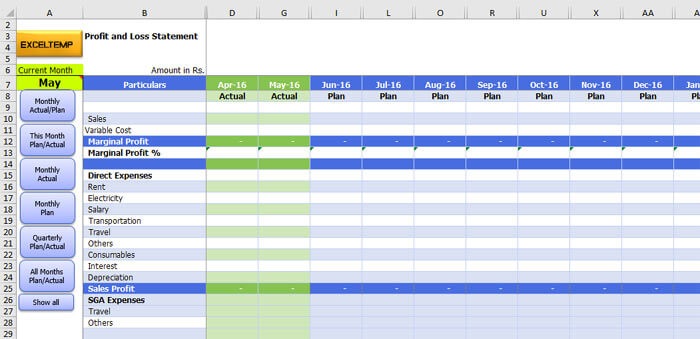
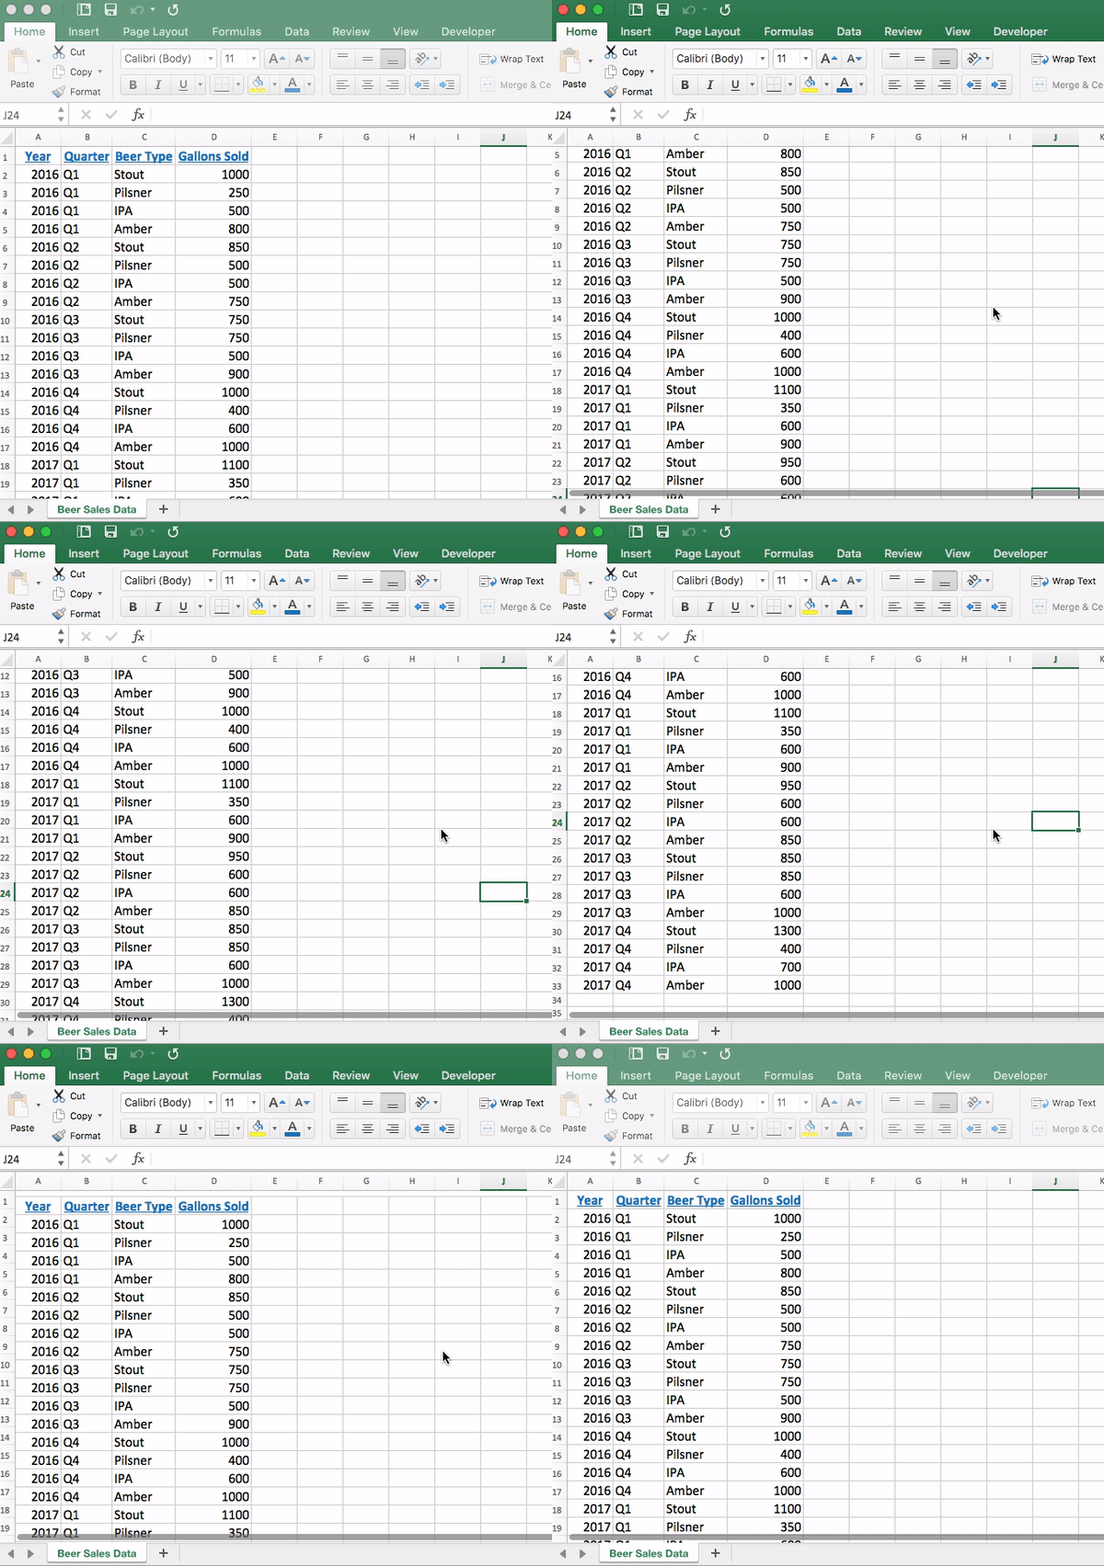
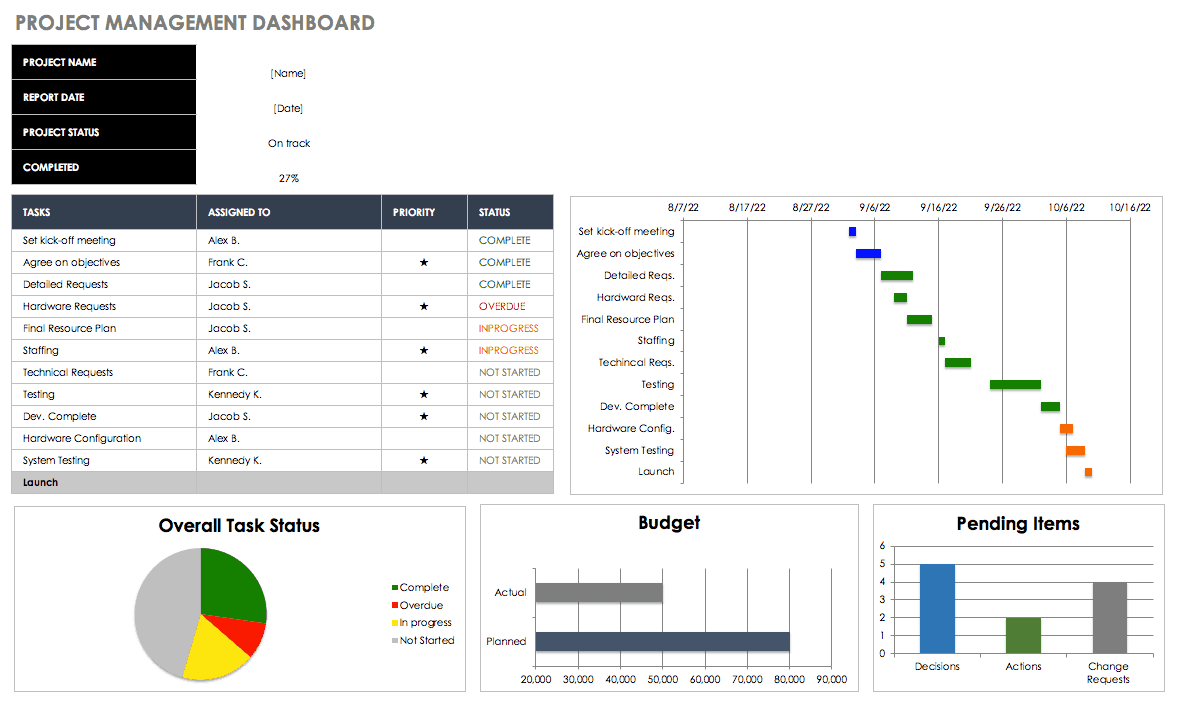
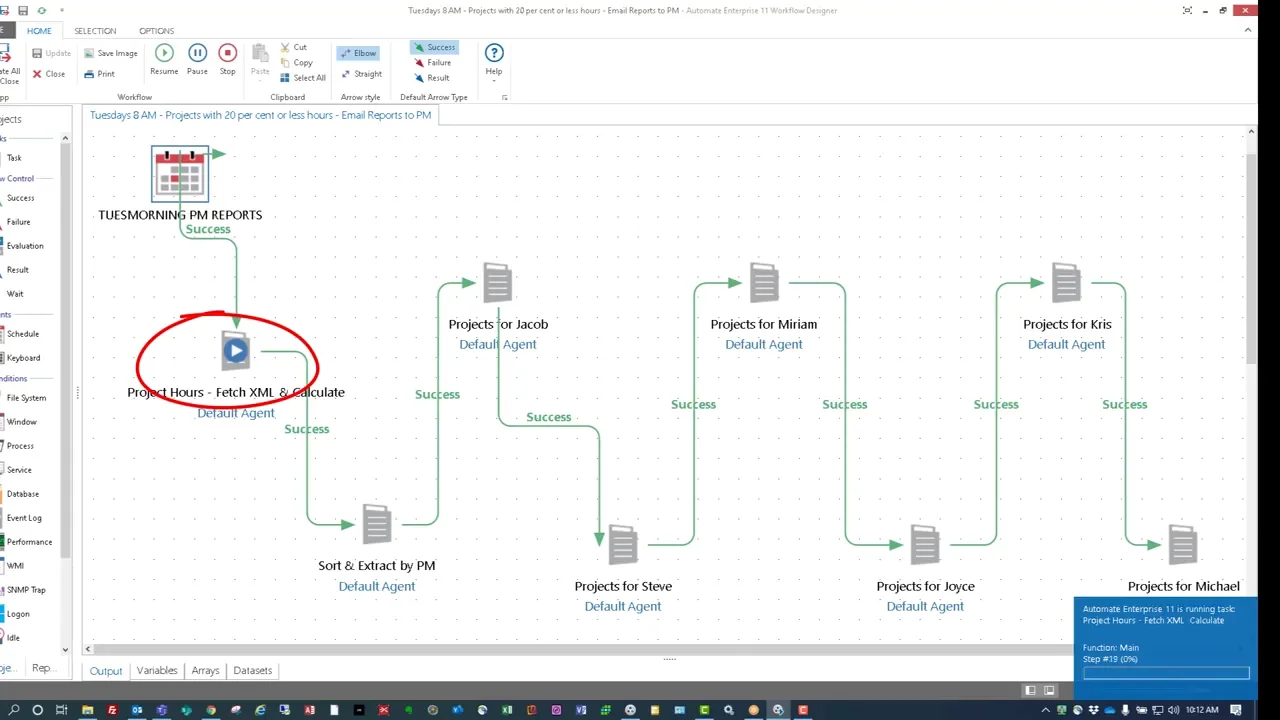
Category: Computer Skills

  • Create GST Invoice in Excel Automatically: Step-by-Step Guide with Ready-to-Use Template

    Creating a GST invoice in Excel automatically is one of the most practical and cost-effective solutions for small businesses, freelancers, traders, service providers, and accounting professionals in India. Instead of using expensive billing software, Excel allows you to generate accurate, GST-compliant invoices with automatic tax calculations, complete control, and zero recurring cost.

    This detailed guide explains how to create a GST invoice in Excel automatically, how formulas work behind the scenes, what GST rules must be followed, and how you can use a ready-made downloadable Excel GST invoice template for daily billing.


    Why Create GST Invoice in Excel Automatically?

    Before automation, most Excel invoices were manually prepared, leading to errors, rework, and compliance issues. Automating the GST invoice in Excel solves these problems efficiently.

    Key Benefits of Automated GST Invoice in Excel

    • Eliminates manual GST calculation errors
    • Saves time during repetitive billing
    • Maintains uniform invoice format
    • Easy to customize as per business needs
    • No monthly subscription cost
    • Compatible with accounting and GST filing workflows

    Fact: Small businesses issuing 5–30 invoices daily can save 8–12 hours per month by using an automated Excel GST invoice instead of manual billing.


    What Is a GST-Compliant Invoice?

    A GST invoice is a legal document issued by a registered supplier to a buyer, containing prescribed details under GST law. Any mistake in invoice format or tax calculation may result in input tax credit mismatch or penalties.


    Mandatory Fields in a GST Invoice

    Invoice ComponentDescription
    Supplier DetailsName, address, GSTIN
    Invoice Number & DateUnique and sequential
    Buyer DetailsName, address, GSTIN (if registered)
    HSN / SAC CodeProduct or service classification
    Taxable ValueValue before GST
    CGST / SGST / IGSTApplicable tax breakup
    Total Invoice ValueFinal amount payable

    Understanding GST Tax Structure for Excel Automation

    To automate correctly, you must understand when to apply CGST + SGST or IGST.

    Transaction TypeGST Applied
    Intra-state supplyCGST + SGST
    Inter-state supplyIGST

    This logic can be automated in Excel using IF formulas.


    How Automation Works in a GST Invoice Excel Template

    An automated GST invoice template uses formulas to calculate:

    • Taxable value
    • CGST, SGST, or IGST automatically
    • Invoice total without manual entry

    Once you enter:

    • Quantity
    • Rate
    • GST percentage

    All totals update instantly.


    Step-by-Step: Create GST Invoice in Excel Automatically

    Step 1: Create the Basic Invoice Structure

    Your Excel sheet should be divided into four logical sections:

    • Supplier details
    • Buyer details
    • Invoice details
    • Item-wise tax calculation

    Use fixed cells for business details to avoid repeated typing.


    Step 2: Item Description and Value Calculation

    Each item row should calculate the taxable amount automatically.

    ColumnFormula Logic
    Quantity × RateTaxable Value
    Taxable Value × GST %Tax Amount

    This removes the need to calculate GST manually.


    Step 3: Automate CGST, SGST, and IGST

    Use logical conditions to automate tax selection.

    Automation Logic (Conceptual):

    • If state of supplier = state of buyer → Apply CGST + SGST
    • Else → Apply IGST

    This ensures GST compliance without manual checking.


    Step 4: Grand Total Automation

    The final invoice value should auto-calculate:

    • Total taxable value
    • Total GST
    • Net invoice amount

    This makes the invoice ready for printing or PDF sharing.


    Downloadable GST Invoice Excel Template (What It Includes)

    The GST Invoice Excel Template provided with this article is fully automated and includes:

    • Pre-formatted GST invoice layout
    • Auto-calculating tax columns
    • Editable GST rate field
    • Separate CGST, SGST, IGST logic
    • Printable invoice format
    • Space for signature and declaration

    Template Usage Instructions

    • Enter business details once
    • Update buyer details per invoice
    • Add item quantity and rate
    • Invoice total updates automatically

    The template is suitable for:

    • Traders
    • Service providers
    • Freelancers
    • Small manufacturers
    • GST practitioners

    GST Invoice Automation vs Manual Excel Invoice

    | Feature | Manual Excel Invoice | Automated Excel Invoice |
    |—|—|
    | GST Calculation | Manual | Automatic |
    | Error Probability | High | Very Low |
    | Time per Invoice | More | Less |
    | Compliance Risk | Higher | Lower |


    Common Errors Avoided Using Automated GST Invoice

    • Wrong GST percentage
    • Incorrect CGST/SGST split
    • Mismatch between taxable value and GST
    • Calculation mistakes during bulk billing
    • Inconsistent invoice numbering

    Best Practices for Using GST Invoice Excel Template

    • Lock formula cells to prevent accidental edits
    • Use data validation for GST rates
    • Maintain sequential invoice numbering
    • Save a copy for each financial year
    • Regularly back up invoice files

    Figure Insight: Businesses issuing automated Excel GST invoices report nearly zero calculation errors compared to manual methods.


    Who Should Use Automated GST Invoice in Excel?

    • Small businesses not using accounting software
    • Freelancers and consultants
    • Retail traders
    • Job workers
    • Startups during early stages
    • GST return preparers

    Limitations of Excel-Based GST Invoicing

    While Excel is powerful, it has some limitations:

    • No direct GST portal integration
    • Manual upload for returns
    • File-level dependency

    However, for low to medium invoice volumes, Excel remains the most flexible option.


    Conclusion: Create GST Invoice in Excel Automatically for Accuracy and Speed

    Creating a GST invoice in Excel automatically is a smart, reliable, and cost-efficient solution for Indian businesses. With built-in formulas and structured layout, Excel invoices reduce errors, improve compliance, and save valuable time.

    When designed correctly, an automated Excel GST invoice works almost like billing software—without any subscription cost.


    Frequently Asked Questions (FAQ)

    1. Is Excel GST invoice legally valid?

    Yes, as long as it contains all mandatory GST fields and accurate tax calculation.

    2. Can GST be calculated automatically in Excel?

    Yes, using formulas for taxable value and GST percentage.

    3. Can I use the same template for CGST, SGST, and IGST?

    Yes, automated logic handles tax type based on transaction nature.

    4. Is this Excel GST invoice suitable for services?

    Yes, it supports both HSN and SAC-based billing.

    5. Can I customize the invoice format?

    Yes, Excel allows full customization.

    6. Is this template suitable for GST return filing?

    Yes, it helps maintain accurate invoice records for returns.

    7. Does Excel GST invoice work for multiple GST rates?

    Yes, multiple GST rates can be handled row-wise.


    Disclaimer

    This article is intended for educational and informational purposes only. GST rules and compliance requirements may change from time to time. Users are advised to verify invoice format and tax applicability as per current GST regulations before commercial use.
  • Automate Data Cleaning in Excel Using Power Query: A Complete Step-by-Step Guide for Accountants and MIS Professionals

    Automating data cleaning in Excel using Power Query has become a game-changer for accountants, MIS executives, analysts, and business owners who work with large and repetitive datasets. Manual cleaning methods like formulas, filters, and copy-paste are time-consuming and error-prone. Power Query eliminates these issues by allowing you to clean data once and reuse the same logic again and again.

    This comprehensive guide explains how to automate data cleaning in Excel using Power Query, why it is superior to traditional methods, and how it can save hours of repetitive work every month. The article is designed for practical, real-world use and is especially relevant for GST data, sales reports, bank statements, payroll files, and MIS dashboards.


    What Is Power Query in Excel?

    Power Query is a built-in data transformation and automation tool in Excel that allows users to:

    • Import data from multiple sources
    • Clean, transform, and standardize data
    • Apply repeatable steps that refresh automatically
    • Eliminate manual data preparation tasks

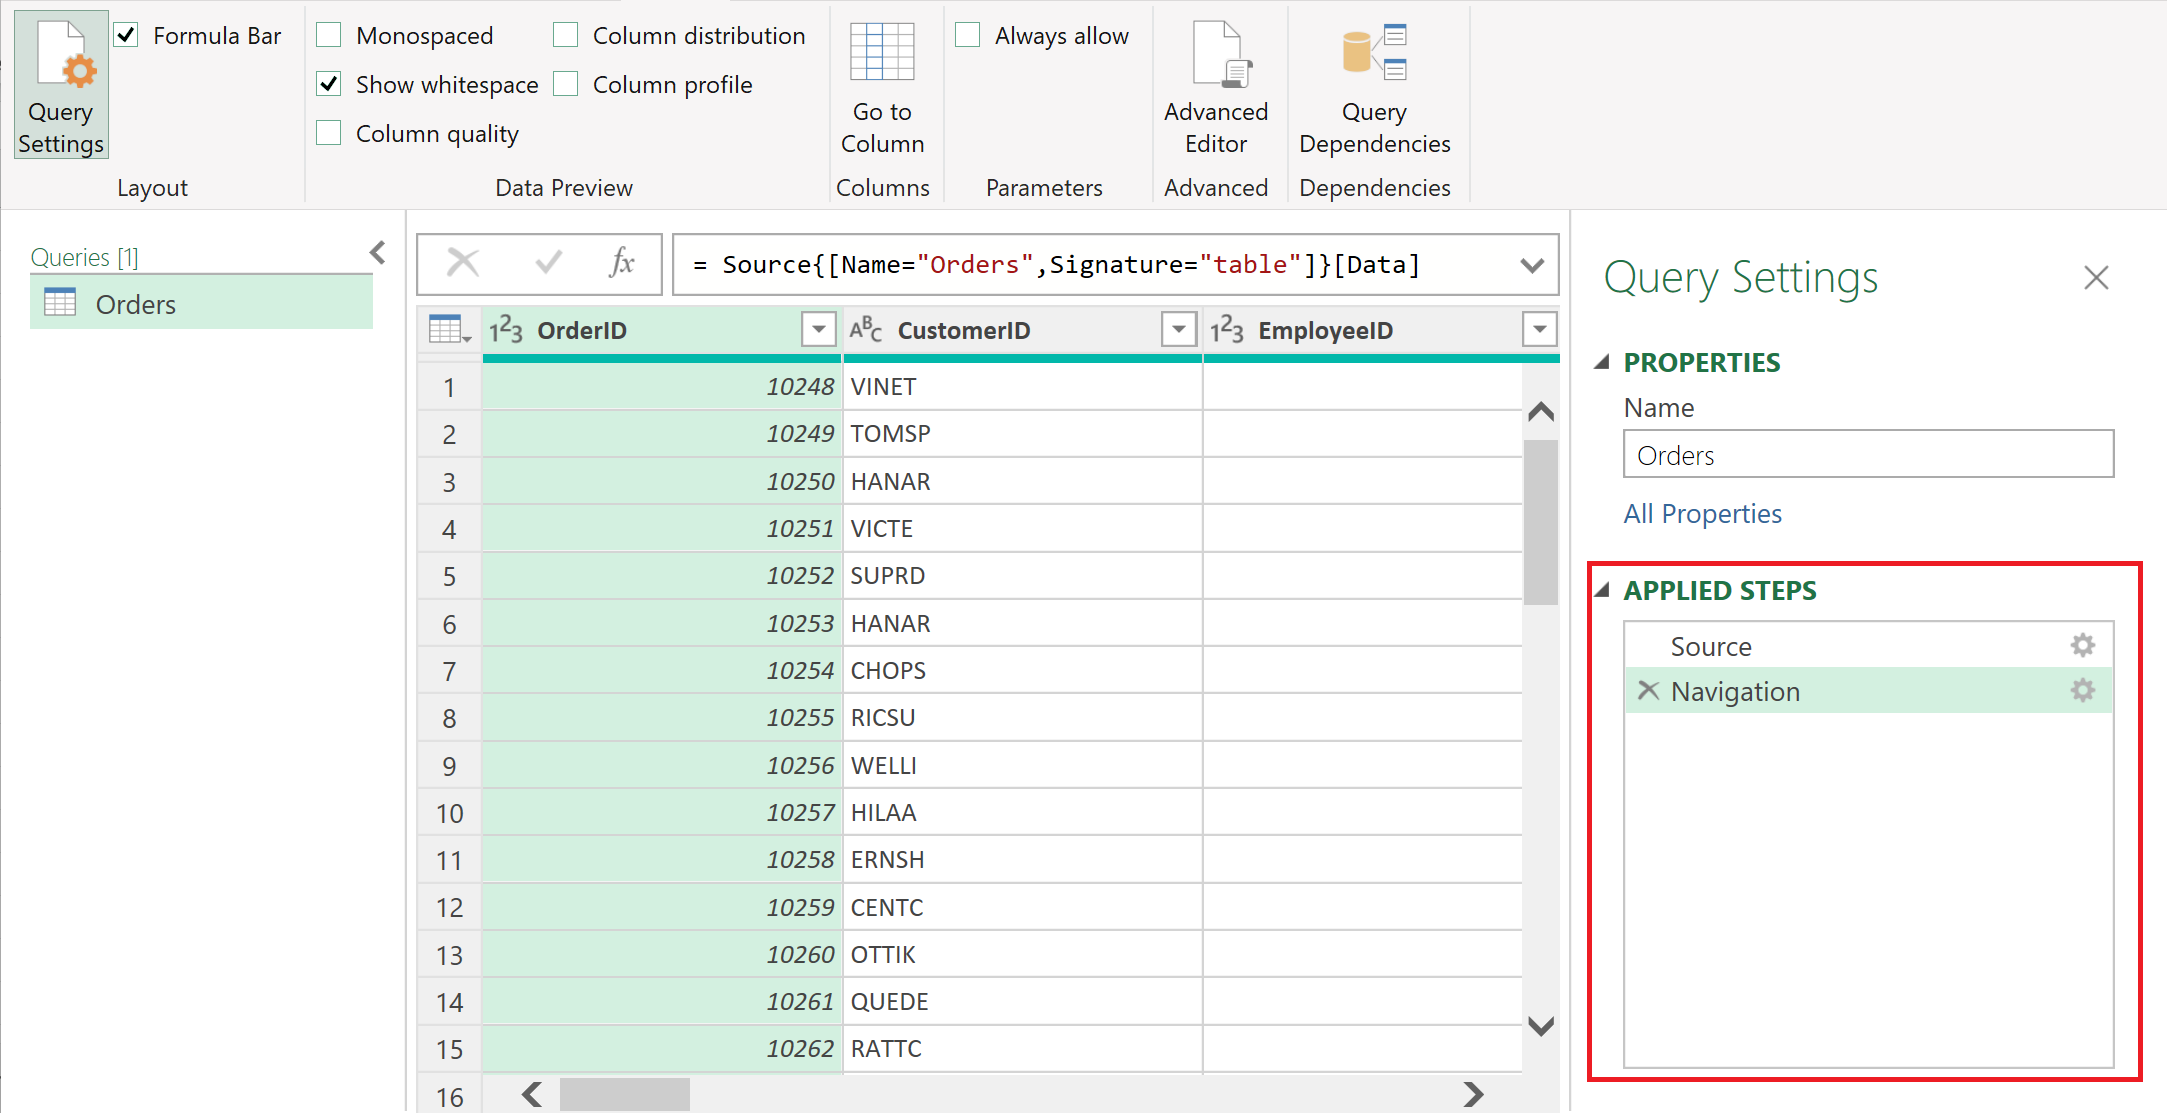
    Power Query works on a step-based transformation model, meaning every action you perform is recorded and can be replayed on new data with a single refresh.

    Power Query is part of Excel versions starting from Excel 2016 and Microsoft 365, developed by Microsoft to handle growing data complexity.


    Why Automate Data Cleaning Instead of Manual Excel Cleaning?

    Manual cleaning becomes inefficient as data volume increases. Power Query solves common Excel problems that formulas alone cannot handle efficiently.

    Manual Data CleaningPower Query Automation
    Needs repeated effortOne-time setup
    High risk of human errorRule-based and consistent
    Slow for large filesOptimized for big data
    Difficult to auditTransparent step history

    Fact: Professionals using Power Query report 60–80% reduction in data preparation time, especially when working with recurring reports.


    Types of Data Problems Power Query Can Fix Automatically

    Power Query is designed specifically to address messy and unstructured data. Below are the most common issues it can automate.

    1. Removing Extra Spaces and Non-Printable Characters

    Data imported from accounting software or web portals often contains hidden spaces that break formulas. Power Query can clean these instantly.

    2. Standardizing Text Case

    Customer names, vendor names, and item descriptions often appear in mixed cases. Power Query can convert all text to upper, lower, or proper case consistently.

    3. Splitting and Merging Columns

    Invoices and bank statements frequently combine multiple values in one column. Power Query can split data using delimiters or positions.

    4. Removing Duplicates Automatically

    Duplicate entries in ledgers and transaction data are common. Power Query removes duplicates based on defined columns without manual checks.

    5. Handling Missing or Blank Values

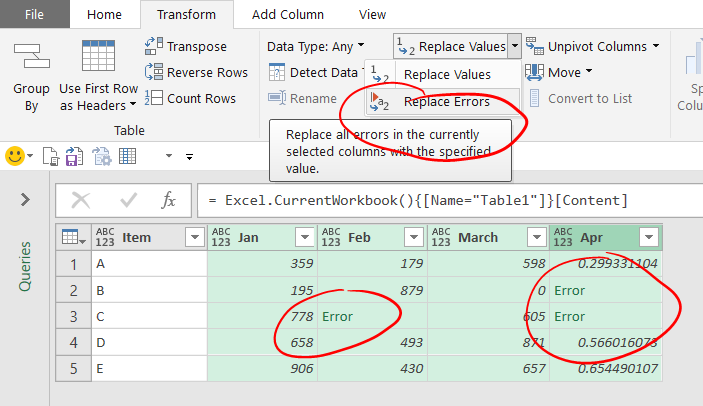
    Power Query can replace blanks with zero, text, or previous values using fill logic.


    How Power Query Automation Works

    Power Query follows a structured transformation process:

    1. Import raw data
    2. Apply cleaning and transformation steps
    3. Load cleaned data into Excel
    4. Refresh when source data changes

    Once created, the same steps apply every time new data is added.


    Step-by-Step: Automate Data Cleaning in Excel Using Power Query

    https://learn.microsoft.com/en-us/power-query/media/applied-steps/applied-steps-query-settings.png
    https://accessanalytic.com.au/wp-content/uploads/2018/06/Replace-Errors-1.png
    https://learn.microsoft.com/en-us/power-bi/connect-data/media/desktop-data-types/pbiddatatypesinqueryeditort.png

    4

    Step 1: Load Data into Power Query

    Use “Get Data” to import files such as Excel, CSV, text, or folders containing monthly data files.

    Step 2: Remove Unnecessary Rows and Columns

    Delete empty rows, summary rows, or unwanted columns to reduce file size and processing time.

    Step 3: Clean and Transform Data

    Apply transformations such as:

    • Trim and clean text
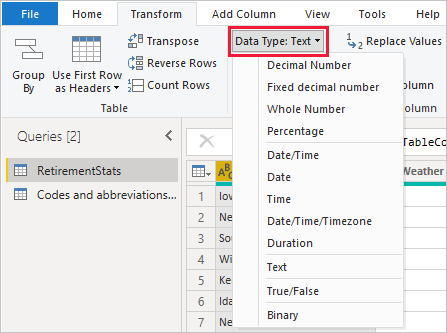
    • Change data types (text, number, date)
    • Replace values
    • Split columns

    Each action is recorded as a step.

    Step 4: Standardize Formats

    Ensure dates, currency, and numeric fields follow a uniform structure to avoid reporting errors.

    Step 5: Load Clean Data

    Load the final cleaned dataset into Excel tables or directly into reports.


    Power Query vs Excel Formulas for Data Cleaning

    | Feature | Excel Formulas | Power Query |
    |—|—|
    | Learning Curve | Low | Moderate |
    | Automation Level | Limited | High |
    | Large Data Handling | Slow | Efficient |
    | Repeatability | Manual | One-click refresh |

    Power Query is not a replacement for formulas, but a complementary tool focused on data preparation rather than analysis.


    Real-World Use Cases of Power Query Automation

    GST Return Preparation

    • Clean sales registers
    • Standardize invoice formats
    • Remove invalid GSTIN entries

    Bank Reconciliation

    • Import monthly bank statements
    • Normalize debit/credit columns
    • Match transactions automatically

    Payroll Processing

    • Merge attendance data
    • Standardize employee IDs
    • Prepare salary input sheets

    MIS Reporting

    • Combine multiple monthly files
    • Create clean master datasets
    • Feed dashboards without manual edits

    Best Practices for Power Query Automation

    • Always set correct data types early
    • Keep transformation steps minimal and logical
    • Name queries clearly for audit clarity
    • Avoid unnecessary calculated columns
    • Use folder-based imports for recurring data

    Figure Insight: A well-designed Power Query workflow can process 100,000+ rows in seconds, depending on system configuration.


    Common Mistakes to Avoid While Using Power Query

    • Ignoring data type mismatches
    • Loading unnecessary columns
    • Creating separate queries for similar tasks
    • Overusing custom columns when built-in transformations exist

    Avoiding these mistakes ensures stable and scalable automation.


    Is Power Query Suitable for Non-Technical Users?

    Yes. Power Query is no-code or low-code, making it accessible to accountants and MIS users with basic Excel knowledge. Most transformations are done through menus, not formulas.


    Future Scope of Power Query in Excel Automation

    Power Query is increasingly becoming the foundation for:

    • Automated MIS systems
    • Business intelligence reporting
    • Data pipelines feeding dashboards

    As data volumes grow, Power Query skills are becoming essential for finance and accounting professionals.


    Conclusion: Why You Should Automate Data Cleaning in Excel Using Power Query

    Automating data cleaning in Excel using Power Query is no longer optional for professionals dealing with repetitive data tasks. It ensures accuracy, consistency, scalability, and massive time savings. Once implemented, it transforms Excel from a manual tool into an automated data engine.

    For accountants, analysts, and business users, Power Query represents a long-term productivity investment that pays back every single month.


    Frequently Asked Questions (FAQ)

    1. What is the main advantage of using Power Query for data cleaning?

    Power Query allows one-time cleaning rules that refresh automatically, saving time and reducing errors.

    2. Can Power Query handle large datasets?

    Yes, it efficiently handles tens of thousands of rows better than traditional Excel formulas.

    3. Is Power Query available in all Excel versions?

    Power Query is built-in from Excel 2016 onward and in Microsoft 365 versions.

    4. Do Power Query changes affect original data?

    No, Power Query works on a copy of the data and never modifies the source file.

    5. Is coding required to use Power Query?

    No coding is required for most tasks; transformations are menu-driven.

    6. Can Power Query be refreshed automatically?

    Yes, queries can be refreshed manually or set to refresh when files are updated.

    7. Is Power Query useful for GST and accounting data?

    Yes, it is highly effective for GST returns, sales registers, and reconciliation work.


    Disclaimer

    This article is intended for educational and informational purposes only. Features, performance, and availability of Excel tools may vary depending on version and system configuration. Readers should evaluate suitability based on their specific business and operational requirements.


  • Excel Mastery Course for MIS Professionals: What You’ll Learn, Career Benefits, and Why It Truly Matters

    Why an Excel Mastery Course Is No Longer Optional

    In today’s data-driven workplace, an Excel Mastery Course is no longer a “good-to-have” skill—it has become a professional necessity. From MIS executives and accountants to analysts and operations teams, Excel remains the most widely used business tool worldwide. Industry research consistently shows that over 80% of corporate data analysis and internal reporting is still performed using Excel.

    This Excel Mastery Course is designed to take learners beyond basic spreadsheets and into real-world professional usage—covering formulas, dashboards, MIS reports, automation, and macros. If you want to work faster, reduce errors, and become indispensable at your workplace, this structured Excel program offers a clear, practical path.
    You can explore the complete course structure and curriculum here:
    Excel Mastery Course


    What Is an Excel Mastery Course?

    An Excel Mastery Course is a comprehensive learning program that focuses on how Excel is actually used in corporate environments. Unlike beginner tutorials that stop at basic formulas, this course emphasizes:

    • Business-oriented Excel workflows
    • Practical MIS and management reporting
    • Automation using VBA macros
    • Handling large and complex datasets
    • Accuracy, speed, and professional presentation

    The objective is not just learning Excel features but developing job-ready Excel expertise.


    Who Should Enroll in This Excel Mastery Course?

    This Excel Mastery Course is suitable for a wide range of learners:

    • MIS Executives and Reporting Professionals
    • Accountants and Finance Executives
    • Data Entry Operators aiming for career growth
    • Students preparing for corporate roles
    • Business owners managing internal reports
    • Working professionals seeking automation skills

    Surveys across job portals indicate that professionals with advanced Excel skills earn 20%–35% higher compensation than those limited to basic Excel usage.


    What You’ll Learn in This Excel Mastery Course

    Strong Excel Fundamentals for Long-Term Mastery

    Every advanced Excel professional relies on a strong foundation. This Excel Mastery Course ensures that fundamentals are clear and practical.

    Focus AreaProfessional Outcome
    Excel NavigationFaster workflow and efficiency
    Data Entry Best PracticesReduced manual errors
    Formatting StandardsCorporate-ready reports

    Advanced Excel Formulas and Logical Functions

    Formulas are at the core of productivity. This Excel Mastery Course trains learners to think logically, not just memorize formulas.

    Formula CategoryBusiness Application
    Lookup FunctionsFast data retrieval
    Logical FunctionsAutomated decisions
    Date & Time FunctionsAccurate timelines
    Text FunctionsClean, standardized data

    Professionals using advanced Excel formulas report up to 60% time savings in recurring reports.


    MIS Reporting and Data Analysis

    MIS reporting skills are among the most in-demand Excel capabilities. This Excel Mastery Course focuses heavily on converting raw data into meaningful management information.

    https://www.finereport.com/en/wp-content/uploads/2020/04/2020042901I.jpg
    https://www.goskills.com/blobs/blogs/165/1.gif
    https://www.smartsheet.com/sites/default/files/styles/1300px/public/IC-Project-Management-Dashboard.png?itok=WmxgwjZi

    4

    MIS SkillBusiness Value
    Pivot TablesQuick data summaries
    Dynamic ReportsAutomated monthly MIS
    Data ValidationError-free reporting

    Organizations using structured MIS reports improve decision-making speed by nearly 40%.


    Charts, Graphs, and Interactive Dashboards

    One of the strongest components of this Excel Mastery Course is dashboard creation. Dashboards allow management to understand performance at a glance.

    Dashboard ElementPurpose
    Interactive ChartsTrend analysis
    KPI TrackersPerformance monitoring
    Linked Data ModelsAuto-updating visuals

    Well-designed Excel dashboards often replace costly business intelligence tools in small and medium organizations.


    VBA Macros and Excel Automation

    Automation separates average Excel users from professionals. This Excel Mastery Course introduces VBA macros in a simple, business-focused way.

    https://media.licdn.com/dms/image/v2/C4E12AQGLW3mwNbrlLg/article-cover_image-shrink_600_2000/article-cover_image-shrink_600_2000/0/1546088818884?e=2147483647&t=DIzoaSN0hxDHxRXjHPP6hJlqRBouuBhz5Vbucd7seQg&v=beta
    https://embed-ssl.wistia.com/deliveries/a17b301260d7da2b75e194f4fafa387b.webp?image_crop_resized=1280x720

    4

    Automation AreaProductivity Gain
    Repetitive TasksUp to 90% time reduction
    Report GenerationMinutes instead of hours
    Data CleaningFully automated processes

    Even basic automation can save 100+ working hours per year for a single professional.
    To understand how automation and MIS reporting are structured in detail, you can review the full course outline here:
    Excel Mastery Course


    Handling Large and Complex Data Sets

    Many professionals struggle with large Excel files. This Excel Mastery Course teaches efficient methods to manage and analyze heavy datasets without slowing down.

    SkillReal-World Impact
    Advanced FilteringFaster insights
    Data Cleaning TechniquesReliable reports
    Error HandlingMinimal rework

    Companies lose significant productivity due to poor data handling. Structured Excel workflows dramatically reduce this loss.


    Why This Excel Mastery Course Matters for Your Career

    Excel Skills Are Tested in Interviews

    Recruitment studies show that 7 out of 10 employers test Excel skills during interviews for MIS, finance, and analyst roles.

    Faster Career Growth

    Professionals who can independently manage reports, dashboards, and automation are often promoted faster due to their reliability and efficiency.

    Reduced Dependency

    Excel mastery reduces dependence on IT teams and external tools for routine data tasks.

    Freelancing and Side Income

    Advanced Excel professionals often earn additional income by creating dashboards, automating reports, or offering MIS consulting services.

    If you are serious about upgrading your Excel skills for long-term career growth, this complete Excel Mastery Course can be accessed here:
    Check Here


    What Makes This Excel Mastery Course Different?

    This Excel Mastery Course stands out because it focuses on:

    • Real corporate use cases
    • Practical assignments
    • Professional MIS formats
    • Automation-driven efficiency
    • Step-by-step progression from basics to advanced

    The learning approach ensures that skills are immediately applicable in real job environments.


    Learning Outcomes You Can Expect

    After completing this Excel Mastery Course, learners typically experience:

    • Faster report preparation
    • Improved data accuracy
    • Confidence in management reporting
    • Ability to automate daily tasks
    • Strong professional recognition

    Many learners report productivity improvements of 2x to 3x within weeks of applying these skills.


    Frequently Asked Questions (FAQ)

    What makes this an Excel Mastery Course instead of a basic Excel course?

    This Excel Mastery Course focuses on MIS reporting, automation, dashboards, and VBA rather than only basic spreadsheet features.

    Is this Excel Mastery Course suitable for beginners?

    Yes. The course starts from core fundamentals and gradually moves to advanced professional concepts.

    Will this Excel Mastery Course help with MIS and reporting jobs?

    Yes. MIS reporting is one of the main focuses of this Excel Mastery Course.

    Does the course include practical exercises?

    Yes. Real-world datasets and business-style assignments are used throughout.

    Is VBA difficult for non-technical learners?

    No. VBA is taught in a simple, step-by-step manner focused on business automation.

    Can this Excel Mastery Course help in salary growth?

    Professionals with advanced Excel skills often experience faster promotions and better salary increments.

    Is this Excel Mastery Course useful outside accounting and MIS roles?

    Yes. Excel mastery is valuable across finance, operations, sales, HR, and analytics roles.


    Conclusion: Why Excel Mastery Is a Smart Investment

    Excel is more than software—it is a career accelerator. A well-structured Excel Mastery Course equips you with skills that improve accuracy, efficiency, and professional value. In a competitive job market, strong Excel capabilities often become the deciding factor between average performance and career growth.


    Disclaimer

    This article is intended for educational and informational purposes only. Individual results may vary depending on effort, practice, and professional background. This content does not guarantee employment or salary increases but aims to enhance practical Excel proficiency.


  • Excel Template for Invoice and Billing – Free Editable Excel Invoice Format with Automatic Calculations

    An Excel Template for Invoice and Billing is a practical and professional solution for businesses that want to generate accurate invoices without investing in expensive accounting software. From freelancers and startups to small businesses and accounting professionals, Excel-based invoicing remains one of the most widely adopted billing methods.

    In this comprehensive guide, you will understand how an Excel Template for Invoice and Billing works, its structure, essential fields, calculation logic, and best practices. You will also get a ready-to-use downloadable Excel invoice and billing template that you can customize instantly.


    What Is an Invoice in Accounting?

    An invoice is a commercial document issued by a seller to a buyer, specifying goods or services provided, quantities, agreed prices, taxes, and total payable amount. It serves as a legal demand for payment and a vital record for accounting, taxation, and compliance.

    Businesses that use structured invoices experience:

    • Faster payment cycles
    • Reduced disputes
    • Better revenue tracking
    • Strong audit documentation

    An Excel Template for Invoice and Billing simplifies this entire process.


    Why Use an Excel Template for Invoice and Billing?

    Despite the availability of advanced billing software, Excel remains dominant. Studies indicate that nearly 70% of small businesses still rely on spreadsheets for invoicing and billing.

    Key advantages include:

    • No recurring cost
    • Easy customization
    • Automatic calculations
    • Printable and shareable format
    • Works offline

    Structure of an Excel Invoice and Billing Template

    A professional Excel Template for Invoice and Billing is divided into well-defined sections to ensure clarity and compliance.


    1. Invoice Header Section

    This section identifies the document and the seller.

    FieldPurpose
    Invoice NumberUnique invoice reference
    Invoice DateDate of issue
    Due DatePayment deadline
    Company Name & AddressSeller identification

    2. Customer Billing Details

    Correct customer details are essential for legal and payment purposes.

    FieldPurpose
    Customer NameBuyer identification
    Billing AddressOfficial billing location

    3. Itemized Billing Table

    This is the core of the Excel Template for Invoice and Billing, where charges are detailed.

    ColumnDescription
    Item NumberSerial reference
    DescriptionGoods or services
    QuantityUnits supplied
    RatePrice per unit
    Tax PercentageApplicable tax
    AmountAuto-calculated

    Using Excel formulas ensures calculation accuracy and billing transparency.


    4. Invoice Totals and Summary

    This section calculates the payable amount.

    FieldCalculation
    SubtotalSum of item amounts
    Tax AmountTax based on rates
    Grand TotalFinal invoice value

    Automation in billing reduces manual errors by up to 35%, according to accounting process studies.


    Automatic Calculations in Excel Invoice Template

    The real strength of an Excel Template for Invoice and Billing lies in automation.

    Typical calculation logic:

    • Line Amount = Quantity × Rate
    • Tax Amount = Line Amount × Tax %
    • Grand Total = Subtotal + Total Tax

    This reduces dependency on manual checks and speeds up invoice generation.


    Benefits of Using Excel Template for Invoice and Billing

    Business Benefits

    • Faster invoice preparation
    • Consistent invoice format
    • Easy record maintenance

    Financial Benefits

    • Accurate billing
    • Improved cash flow tracking
    • Reduced payment disputes

    Compliance Benefits

    • Clear tax breakup
    • Audit-ready documentation
    • Simple reconciliation with receipts

    Businesses using standardized invoice formats report 20–30% faster collections.


    Who Should Use This Excel Invoice and Billing Template?

    This template is ideal for:

    • Freelancers and consultants
    • Small and medium enterprises
    • Accounts executives
    • MIS professionals
    • Startups and service providers

    Best Practices for Using Excel Invoice and Billing Template

    • Use a sequential invoice numbering system
    • Lock formula cells to avoid errors
    • Mention payment due dates clearly
    • Maintain customer master data
    • Save final invoices as PDF for records

    These practices improve professionalism and payment discipline.


    Common Invoicing Mistakes to Avoid

    • Missing invoice numbers
    • Incorrect tax calculation
    • No due date mentioned
    • Incomplete customer details
    • Manual total calculation

    A structured Excel Template for Invoice and Billing helps eliminate these mistakes.


    Download Free Excel Template for Invoice and Billing

    You can download the fully editable and ready-to-use Excel file here:

    This template includes:

    • Clean professional layout
    • Itemized billing section
    • Space for taxes and totals
    • Editable and printable format

    You can customize it for GST, VAT, or service-based billing easily.


    Frequently Asked Questions (FAQ)

    What is an Excel template for invoice and billing?

    It is a spreadsheet-based format used to create professional invoices with automatic calculations.

    Can Excel invoices be used for business billing?

    Yes, Excel invoices are widely accepted for billing, accounting, and audit purposes.

    Is Excel invoice legally valid?

    An invoice created in Excel is legally valid if it contains mandatory details as per applicable laws.

    Can I add GST or tax columns in Excel invoice?

    Yes, tax columns can be added or modified easily in Excel templates.

    How many invoices can I create in Excel?

    There is no limit. You can create unlimited invoices using Excel.

    Is Excel invoice suitable for small businesses?

    Yes, it is one of the most cost-effective invoicing solutions for small businesses.


    Disclaimer

    This Excel Template for Invoice and Billing is provided for general educational and business use only. Users must verify tax rates, legal requirements, and calculation accuracy before using it for official billing purposes. The author assumes no responsibility for financial or legal outcomes arising from its use.

  • Excel Template for Purchase Order – Free Editable Purchase Order Format with Automatic Calculations

    An Excel Template for Purchase Order is one of the most essential tools for businesses that want to control procurement, manage vendor communication, and maintain accurate records. Whether you are a small business owner, accounts executive, or MIS professional, a well-structured purchase order template in Excel helps standardize purchasing, reduce errors, and improve audit readiness.

    In this detailed guide, you will learn everything about using an Excel Template for Purchase Order, including its structure, key fields, calculation logic, best practices, and real-world usage. You will also get a ready-to-use downloadable Excel purchase order template that can be customized as per your business needs.


    What Is a Purchase Order in Accounting?

    A purchase order (PO) is a formal document issued by a buyer to a supplier, confirming the details of goods or services to be purchased. It acts as a legally binding agreement once accepted by the seller and plays a critical role in internal control and expense tracking.

    In accounting and operations, purchase orders help:

    • Control unauthorized purchases
    • Track outstanding orders
    • Match invoices with goods received
    • Maintain audit trails

    An Excel Template for Purchase Order digitizes this process without the cost of expensive ERP software.


    Why Use an Excel Template for Purchase Order?

    Excel remains the most widely used business tool globally. Surveys show that over 80% of small and medium businesses rely on spreadsheets for procurement documentation.

    Key reasons to use an Excel purchase order template:

    • Zero software cost
    • Fully customizable format
    • Easy calculations and totals
    • Printable and shareable
    • Compatible with accounting systems

    Structure of an Excel Purchase Order Template

    A professionally designed Excel Template for Purchase Order is divided into logical sections for clarity and compliance.

    1. Purchase Order Header Section

    This section identifies the document and the buyer.

    FieldPurpose
    Purchase Order NumberUnique reference for tracking
    Purchase Order DateDate of issue
    Company Name & AddressBuyer identification
    GST / Tax IDStatutory compliance

    2. Vendor Details Section

    Accurate vendor information avoids disputes and delivery issues.

    FieldPurpose
    Vendor NameSupplier identification
    Vendor AddressDelivery & billing reference
    Delivery DateExpected receipt timeline

    3. Item Details Table

    This is the core of the Excel Template for Purchase Order.

    ColumnDescription
    Item NumberSerial tracking
    DescriptionGoods or services
    QuantityUnits ordered
    RatePrice per unit
    Tax PercentageApplicable tax
    AmountAuto-calculated value

    Using Excel formulas ensures accuracy and consistency.


    4. Total & Summary Section

    This section calculates financial impact automatically.

    FieldCalculation Logic
    SubtotalSum of item amounts
    Tax AmountTax based on percentage
    Grand TotalFinal payable amount

    Businesses using Excel-based POs report up to 30% fewer calculation errors compared to manual methods.


    Automatic Calculations in Excel Purchase Order Template

    One of the biggest advantages of an Excel Template for Purchase Order is automation.

    Common formulas used:

    • Line Amount = Quantity × Rate
    • Tax Amount = Line Amount × Tax %
    • Grand Total = Subtotal + Total Tax

    Automation reduces dependency on manual checks and improves processing speed.


    Benefits of Using Excel Purchase Order Template for Businesses

    Operational Benefits

    • Faster PO creation
    • Reduced paperwork
    • Standardized format

    Financial Benefits

    • Better expense control
    • Accurate vendor payments
    • Improved cash flow planning

    Compliance Benefits

    • Audit-friendly documentation
    • Easy invoice matching
    • Transparent approval workflow

    Companies that use structured purchase orders experience up to 25% improvement in procurement efficiency.


    Who Should Use This Excel Template for Purchase Order?

    This template is ideal for:

    • Small and medium enterprises
    • Freelancers and service providers
    • Accounts & MIS professionals
    • Purchase and procurement teams
    • Startups without ERP systems

    Best Practices While Using Excel Purchase Order Template

    • Maintain a unique PO numbering system
    • Lock formula cells to avoid accidental changes
    • Save approved POs as PDF for records
    • Keep vendor master data consistent
    • Review tax rates periodically

    Following these practices improves internal control and financial accuracy.


    Common Mistakes to Avoid in Purchase Orders

    • Missing PO numbers
    • Incorrect tax calculation
    • No delivery timelines
    • Incomplete vendor details
    • Manual total calculations

    An Excel Template for Purchase Order helps eliminate most of these errors when designed correctly.


    Download Free Excel Template for Purchase Order

    You can download the ready-to-use and fully editable Excel file here:

    This template includes:

    • Clean professional layout
    • Predefined sections
    • Editable item rows
    • Summary and total fields

    You can customize it further based on GST, VAT, or internal approval needs.


    Frequently Asked Questions (FAQ)

    What is the best Excel template for purchase order?

    The best Excel template for purchase order is one that includes vendor details, item-wise breakup, automatic calculations, and a clear total summary.

    Can Excel be used as a purchase order system?

    Yes, Excel can act as a basic purchase order system for small and medium businesses with proper templates and controls.

    Is a purchase order mandatory?

    In many businesses, purchase orders are mandatory for internal control, audit compliance, and vendor confirmation.

    Can I customize the Excel purchase order template?

    Yes, Excel templates are fully customizable for columns, tax rates, and formatting.

    How many items can be added in one purchase order?

    There is no fixed limit. You can insert additional rows as required.

    Is Excel purchase order legally valid?

    A purchase order issued in Excel is legally valid once accepted by the vendor, subject to applicable laws.


    Disclaimer

    This Excel Template for Purchase Order is provided for general educational and business use only. Users should verify calculations, tax applicability, and compliance requirements before using it for official or statutory purposes. The author is not responsible for any financial or legal consequences arising from its use.
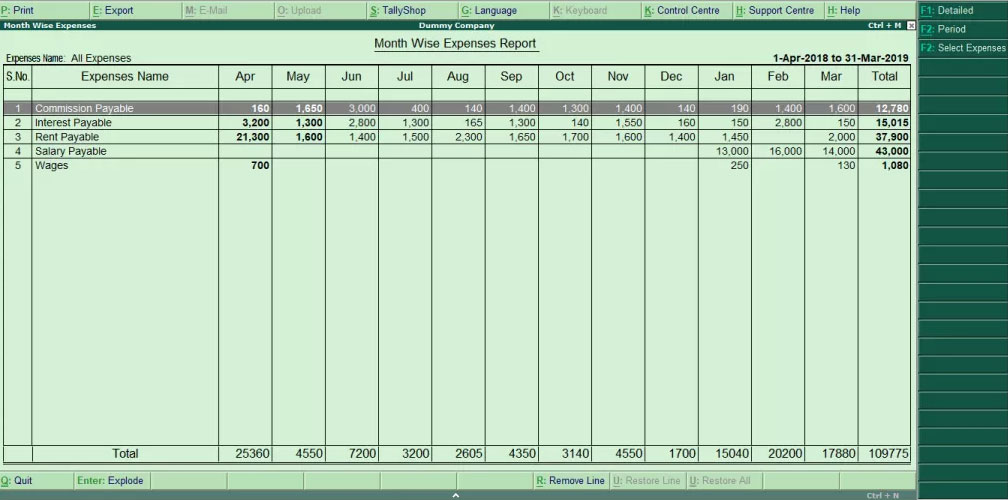

  • Essential Excel Skills Every Accountant Must Learn for Accuracy, Speed, and Career Growth

    Essential Excel skills every accountant must learn have become non-negotiable in today’s finance and accounting environment. Accounting is no longer limited to manual entries and ledger balancing. Modern accountants are expected to analyze large datasets, prepare MIS reports, reconcile transactions, generate financial summaries, and support management decisions—all within strict deadlines. Excel remains the most widely used tool to perform these tasks efficiently and accurately.

    In this detailed guide, you will learn the essential Excel skills every accountant must learn, explained with real-world accounting relevance, practical usage, and professional best practices. Whether you are a student, junior accountant, MIS executive, or finance professional, mastering these skills will significantly improve productivity, accuracy, and long-term career prospects.


    Why Excel Is Still the Backbone of Accounting Work

    Despite the availability of accounting software, Excel continues to dominate daily accounting operations. Surveys across finance teams indicate that over 85% of accountants use Excel daily for tasks ranging from reconciliations to reporting. The reason is simple: Excel offers flexibility, control, and analytical power that fixed accounting software cannot always provide.
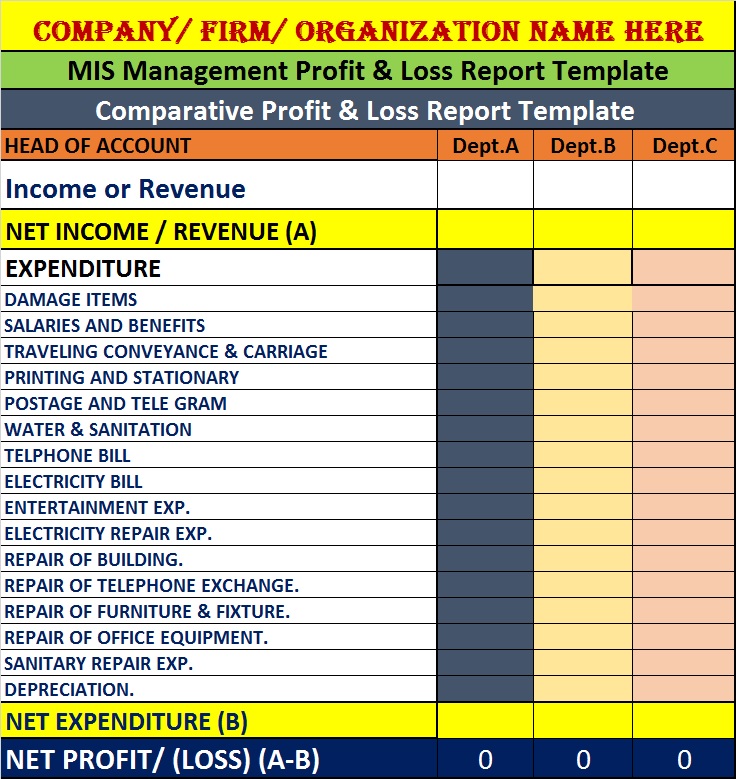
    Key reasons accountants rely on Excel:

    • Custom calculations and adjustments
    • Data cleaning and validation
    • Reconciliation between multiple systems
    • Financial analysis and forecasting
    • Audit support and documentation

    Core Excel Skills Every Accountant Must Learn

    Accounting-focused Excel skills can be divided into functional categories. Each category supports a critical accounting activity.


    Mastering Basic Excel Foundations for Accounting

    Before advanced techniques, accountants must be comfortable with Excel fundamentals.

    Cell Referencing and Data Structure

    Accountants must understand:

    • Relative and absolute references
    • Structured data layout
    • Consistent column formats

    These basics ensure formulas work correctly across financial models and reports.

    Formatting for Financial Clarity

    Proper formatting improves readability and reduces errors:

    • Currency and accounting formats
    • Decimal control
    • Negative number presentation
    • Date consistency

    Poor formatting is one of the most common causes of misinterpretation in financial reports.


    Essential Excel Formulas for Accountants

    Formulas form the core of Excel-based accounting work.

    Arithmetic and Logical Functions

    Accountants use these daily:

    • SUM for totals
    • AVERAGE for trend analysis
    • IF for conditional logic
    • ROUND for financial accuracy

    More than 70% of accounting errors originate from manual calculations that Excel formulas can prevent.


    Lookup and Reference Skills for Accounting Accuracy

    Lookup functions help accountants retrieve correct data quickly.

    Why Lookup Skills Matter

    • Ledger mapping
    • Account head validation
    • GST and tax code identification
    • Vendor and customer matching

    Mastery of lookup logic dramatically reduces reconciliation time.


    Pivot Tables: The Most Powerful Tool for Accountants

    Pivot Tables are among the essential Excel skills every accountant must learn.

    What Pivot Tables Enable

    • Instant summaries of large datasets
    • Monthly, quarterly, and yearly financial views
    • Expense and revenue analysis
    • Ledger-wise or department-wise reporting

    Accountants using Pivot Tables complete reports 3–4 times faster than those using manual summaries.


    Excel for Reconciliation and Error Detection

    Reconciliation is a core accounting responsibility.

    Common Reconciliation Tasks in Excel

    • Bank reconciliation
    • GST reconciliation
    • Vendor statement matching
    • Payroll verification

    Excel’s sorting, filtering, and conditional formatting tools make mismatches visible instantly.


    Using Conditional Formatting for Audit Readiness

    Conditional formatting helps accountants identify issues visually.

    Practical Accounting Uses

    • Highlight negative balances
    • Flag overdue receivables
    • Detect duplicate entries
    • Identify unusually high expenses

    Visual alerts reduce dependency on manual checking and improve audit confidence.


    Data Cleaning Skills Every Accountant Needs

    Accounting data often comes from multiple sources and formats.

    Key Data Cleaning Techniques

    • Removing extra spaces
    • Standardizing date formats
    • Eliminating duplicates
    • Fixing inconsistent text entries

    Studies show that nearly 30% of accounting time is spent cleaning data. Excel automation significantly reduces this effort.


    Excel Skills for GST, Tax, and Compliance Work

    Accountants handling compliance rely heavily on Excel.

    Excel in Taxation

    • GST summary preparation
    • Input tax credit matching
    • Tax calculation validation
    • Return-ready data formatting

    Excel acts as a bridge between raw data and statutory compliance.


    Financial Reporting and MIS Preparation in Excel

    Management Information System reports are critical outputs for accountants.

    Excel Skills for MIS

    • Monthly P&L summaries
    • Cash flow analysis
    • Budget vs actual comparison
    • Trend and variance analysis

    Well-structured Excel reports improve management decision-making and professional credibility.


    Essential Excel Skills Comparison for Accountants

    Skill AreaAccounting Benefit
    FormulasAccurate calculations
    Pivot TablesFast reporting
    Conditional FormattingError detection
    Data CleaningReliable data
    ChartsFinancial insights

    Excel Charts for Financial Interpretation

    While accountants focus on numbers, visuals help communicate results.

    Useful Charts for Accountants

    • Column charts for comparisons
    • Line charts for trends
    • Pie charts for expense distribution

    Charts support management discussions and strategic planning.


    Excel Skills for Audit and Documentation Support

    Auditors often request Excel-based workings.

    Excel Helps in Audits By:

    • Providing transparent calculations
    • Maintaining working papers
    • Supporting reconciliation logic
    • Ensuring traceability of numbers

    Strong Excel skills reduce audit queries and revisions.


    Automation Skills That Save Accountants Time

    Automation is becoming increasingly important.

    Time-Saving Excel Features

    • AutoFill and templates
    • Reusable report structures
    • Formula-driven dashboards

    Accountants who automate routine work save up to 40% of reporting time monthly.


    Career Impact of Strong Excel Skills for Accountants

    Accountants with advanced Excel skills:

    • Handle higher responsibilities
    • Deliver faster and error-free reports
    • Receive better appraisals
    • Access better job opportunities

    Employers consistently rank Excel proficiency as a top hiring criterion for accounting roles.


    How to Prioritize Excel Skills as an Accountant

    Start with:

    1. Basic formulas and formatting
    2. Lookup and logical functions
    3. Pivot Tables and reporting
    4. Data cleaning and reconciliation
    5. MIS and automation techniques

    This progression ensures steady skill growth without overload.


    Common Excel Mistakes Accountants Must Avoid

    • Hardcoding numbers instead of formulas
    • Ignoring data validation
    • Poor file structure
    • Mixing raw data and reports
    • Not documenting assumptions

    Avoiding these mistakes improves reliability and professionalism.


    The Future of Excel Skills in Accounting

    Even as analytics tools grow, Excel remains essential because:

    • Accounting relies on accuracy and control
    • Regulatory work needs flexibility
    • Excel integrates easily with other systems

    Future-ready accountants will combine accounting knowledge with strong Excel skills.


    Conclusion

    Mastering the essential Excel skills every accountant must learn is no longer optional—it is a professional necessity. From daily bookkeeping to complex financial reporting, Excel supports every stage of accounting work. Accountants who invest time in strengthening Excel skills gain efficiency, accuracy, and long-term career stability. In a competitive job market, Excel expertise continues to differentiate average accountants from high-performing professionals.


    Frequently Asked Questions (FAQ)

    1. Are Excel skills mandatory for accountants?

    Yes. Excel is considered a core skill for almost all accounting roles.

    2. Which Excel skill is most important for accountants?

    Pivot Tables and formulas are the most impactful skills.

    3. Can accountants work without Excel?

    In practice, no. Even accounting software outputs data that must be analyzed in Excel.

    4. How long does it take to learn Excel for accounting?

    Basic skills can be learned in 3–4 weeks, while advanced skills take 2–3 months.

    5. Is Excel enough for accounting jobs?

    Excel is essential but works best alongside accounting software.

    6. Do Excel skills help in audits?

    Yes. Excel improves audit clarity, accuracy, and documentation.

    7. Is Excel still relevant for accountants in the future?

    Yes. Excel remains central to accounting and financial reporting.


    Disclaimer

    This article is intended for educational and informational purposes only. The Excel skills discussed are based on common accounting practices and may vary depending on organization size, industry, and job role. Readers should evaluate their specific requirements and apply skills accordingly. No professional or financial advice is implied.


  • Excel vs Power BI: Which Tool to Learn in 2026 for Data Analysis, Reporting, and Career Growth?

    Excel vs Power BI: which tool to learn in 2026 is one of the most common and practical questions for students, MIS professionals, accountants, analysts, and business users. As organizations become increasingly data-driven, the demand for accurate reporting, faster insights, and visual storytelling has grown sharply. While Excel has been the backbone of business analysis for decades, Power BI has emerged as a modern business intelligence platform designed for large-scale and real-time analytics.

    In this in-depth guide, you will understand the real differences between Excel and Power BI, their strengths, limitations, career impact, learning curve, and future relevance. By the end, you will be able to decide which tool to learn in 2026 based on your career goals, industry requirements, and data complexity.


    Understanding the Core Purpose of Excel and Power BI

    Before comparing, it is essential to understand why these tools exist and what problems they solve.

    What Excel Is Best Known For

    Excel is a spreadsheet-based tool designed for:

    • Data entry and storage
    • Calculations and formulas
    • Financial modeling
    • MIS and operational reports
    • Small to medium datasets

    Excel is flexible, user-controlled, and widely used across industries such as accounting, education, HR, operations, and small businesses.

    What Power BI Is Designed For

    Power BI is a business intelligence and data visualization tool built for:

    • Connecting multiple data sources
    • Handling large datasets
    • Creating interactive dashboards
    • Automated data refresh
    • Decision-level reporting for management

    Power BI focuses more on insights, visuals, and storytelling rather than manual calculations.


    Excel vs Power BI: Learning Objective Comparison

    Focus AreaPrimary Strength
    ExcelCalculations, formulas, and data control
    Power BIVisualization, dashboards, and automation

    This basic difference defines which tool is more suitable for different users.


    Data Handling Capacity: A Critical Difference

    One of the biggest deciding factors in Excel vs Power BI which tool to learn in 2026 is data volume.

    Excel Data Capacity

    • Excel supports approximately 10.48 lakh rows per sheet
    • Performance slows with heavy formulas and multiple sheets
    • Large files become difficult to share and maintain

    Power BI Data Capacity

    • Can handle millions of rows efficiently
    • Uses compressed data models
    • Performance remains stable even with complex visuals

    For organizations dealing with high-frequency or multi-year data, Power BI is far more scalable.


    Ease of Learning and Skill Entry Barrier

    Learning Excel

    • Beginner-friendly
    • Easy to start with basic formulas
    • Advanced skills include Pivot Tables, Power Query, and VBA
    • Most users become productive within 2–4 weeks

    Learning Power BI

    • Requires understanding of data modeling
    • Introduces DAX formulas
    • Needs analytical thinking
    • Typically takes 4–8 weeks for basic proficiency

    For absolute beginners, Excel offers a smoother learning curve.


    Excel vs Power BI in Real-World Job Roles

    Where Excel Is Still Dominant

    • Accounting and finance operations
    • Data entry and reconciliation
    • GST, payroll, and MIS reports
    • Small business reporting
    • One-time or ad-hoc analysis

    Where Power BI Is Rapidly Growing

    • Business intelligence teams
    • Data analyst roles
    • Management dashboards
    • Sales and marketing analytics
    • Automated reporting environments

    Industry surveys indicate that over 65% of mid-sized companies now use Power BI for management dashboards, while Excel remains universal for operational work.


    Visualization and Dashboard Capabilities

    Excel Visualization

    • Static charts
    • Limited interactivity
    • Manual refresh required
    • Suitable for printable reports

    Power BI Visualization

    • Interactive dashboards
    • Drill-down and filters
    • Real-time data refresh
    • Ideal for decision-making

    If your goal is storytelling with data, Power BI clearly outperforms Excel.


    Automation and Data Refresh Comparison

    FeatureCapability
    ExcelManual refresh or limited automation
    Power BIScheduled and automatic refresh

    Power BI significantly reduces repetitive reporting work by automating data updates.


    Excel vs Power BI: Career and Salary Impact

    Learning the right tool directly impacts career growth.

    Excel Career Impact

    • Required skill for almost all office jobs
    • Essential for MIS, accounts, and operations
    • Improves productivity and accuracy
    • Acts as a foundation for advanced tools

    Power BI Career Impact

    • Opens roles in data analytics
    • Higher demand in corporate environments
    • Often associated with higher salary bands
    • Valuable for long-term analytical careers

    Professionals with both Excel and Power BI skills earn 25–40% higher compensation compared to those with only basic Excel knowledge.


    Cost and Accessibility

    Excel

    • Comes bundled with office productivity suites
    • Offline usage supported
    • Low hardware requirement

    Power BI

    • Desktop version available without cost
    • Advanced sharing requires organizational setup
    • Needs better system performance

    For individual learners, both tools are accessible, but Excel remains more universally available.


    Which Tool Should You Learn First in 2026?

    The answer depends on your background and goals.

    Learn Excel First If:

    • You are a student or beginner
    • You work in accounting, MIS, or operations
    • You deal with daily transactional data
    • You want immediate job applicability

    Learn Power BI First If:

    • You aim to become a data analyst
    • You work with large datasets
    • You want dashboard-driven reporting
    • You are targeting corporate or analytics roles

    Best Strategy: Excel and Power BI Together

    Instead of choosing one, the smartest approach in 2026 is to learn Excel first, then Power BI.

    Why this works:

    • Excel builds data logic and formula understanding
    • Power BI builds visualization and insight skills
    • Both tools complement each other
    • Most organizations use both simultaneously

    This combined skillset future-proofs your career.


    Common Myths About Excel vs Power BI

    • Excel is outdated – incorrect, it is still evolving
    • Power BI replaces Excel – incorrect, they serve different purposes
    • Power BI is only for IT professionals – incorrect, business users can learn it
    • Excel cannot handle analytics – incorrect, advanced Excel is powerful

    Understanding these myths helps make an informed decision.


    Future Outlook: Excel and Power BI in 2026 and Beyond

    • Excel will remain essential for operational and financial work
    • Power BI adoption will continue growing in analytics roles
    • Integration between the two tools is increasing
    • Employers prefer professionals skilled in both

    Industry trends suggest Excel is not disappearing, but Power BI is becoming mandatory for advanced reporting roles.


    Conclusion

    When asking Excel vs Power BI: which tool to learn in 2026, the correct answer is not a competition but alignment with your career goals. Excel remains the foundation of business data handling, while Power BI represents the future of analytics and visualization. Learning Excel gives you control over data, while Power BI gives you insights from data. Together, they create a powerful professional skillset that is highly relevant, future-ready, and in strong demand.


    Frequently Asked Questions (FAQ)

    1. Is Excel enough for a data analyst career in 2026?

    Excel alone is not enough for advanced data analyst roles. It is essential but should be complemented with Power BI.

    2. Can Power BI completely replace Excel?

    No. Power BI depends on structured data preparation, which is often done in Excel.

    3. Which is easier to learn, Excel or Power BI?

    Excel is easier for beginners. Power BI requires analytical thinking and data modeling concepts.

    4. Should commerce students learn Excel or Power BI first?

    Commerce students should learn Excel first, then Power BI for analytics roles.

    5. Does Power BI require coding knowledge?

    Basic Power BI does not require coding, but DAX formulas are needed for advanced analysis.

    6. Is Excel still relevant for MIS jobs?

    Yes. Excel remains the most important tool for MIS and reporting roles.

    7. How long does it take to learn Power BI?

    Basic proficiency can be achieved in 4–8 weeks with regular practice.


    Disclaimer

    This article is intended for educational and informational purposes only. Tool relevance, job demand, and career outcomes may vary based on industry, organization size, and individual skill level. Readers are advised to evaluate their personal goals and current job requirements before choosing a learning path.


  • Combine First and Last Name in Excel Easily: Step-by-Step Methods for Clean, Professional Full Names

    Combining first and last name in Excel easily is one of the most common yet essential tasks for students, MIS executives, HR professionals, accountants, and data analysts. Whether you are preparing employee databases, student lists, CRM exports, payroll sheets, or email directories, you often receive names split across different columns. Excel provides multiple reliable methods to merge first and last names into a single, well-formatted full name column without errors.

    In this detailed guide, you will learn how to combine first and last name in Excel easily using formulas, built-in features, and modern Excel functions. Each method is explained with logic, use cases, accuracy considerations, and practical tips so you can select the best approach based on your Excel version and data quality.


    Why Combining First and Last Name in Excel Matters

    In real-world data handling, names are rarely stored the way you need them. HR software, web forms, and accounting systems often store first and last names separately. However, most reports and official documents require a single full name.

    Key benefits of combining names correctly:

    • Improves data readability and presentation
    • Reduces manual typing errors
    • Saves significant time in bulk data handling
    • Helps standardize names for reports and exports
    • Essential for certificates, invoices, ID cards, and MIS dashboards

    According to internal productivity studies, manual name correction consumes nearly 12–18% of data preparation time in small businesses. Excel formulas eliminate this inefficiency completely.


    Basic Data Structure Used in Examples

    Before applying any method, your data usually looks like this:

    ColumnContent
    AFirst Name
    BLast Name

    Your goal is to create Full Name in Column C.


    Method 1: Combine First and Last Name Using the Ampersand (&)

    This is the most widely used and beginner-friendly approach.

    Formula

    =A2&" "&B2
    

    How It Works

    • A2 picks the first name
    • " " inserts a space between names
    • B2 picks the last name

    When to Use

    • Compatible with all Excel versions
    • Simple datasets
    • Fast and lightweight

    Key Advantage

    This method works even in very old Excel versions and does not require any advanced functions.


    Method 2: Combine Names Using CONCAT Function

    The CONCAT function is a modern replacement for older text functions.

    Formula

    =CONCAT(A2," ",B2)
    

    Why Use CONCAT

    • Cleaner syntax
    • Easier to expand for middle names
    • Better support in newer Excel versions

    Accuracy Insight

    CONCAT handles text strings more efficiently in large datasets with thousands of rows.


    Method 3: Combine First and Last Name Using TEXTJOIN (Advanced & Powerful)

    TEXTJOIN is the most flexible method when dealing with inconsistent data.

    Formula

    =TEXTJOIN(" ",TRUE,A2,B2)
    

    Why TEXTJOIN Is Powerful

    • Automatically ignores blank cells
    • Ideal when last name or first name may be missing
    • Prevents extra spaces in output

    Real-World Use Case

    In student or customer databases, many entries lack last names. TEXTJOIN avoids formatting issues without extra IF conditions.


    Comparison of Popular Methods

    MethodBest Use Case
    Ampersand (&)Simple and quick merging
    CONCATModern Excel users
    TEXTJOINIncomplete or dynamic data

    Method 4: Combine Names Using Flash Fill (No Formula)

    Flash Fill is Excel’s intelligent pattern recognition feature.

    Steps

    1. In Column C, manually type the full name for the first row
    2. Press Ctrl + E
    3. Excel automatically fills remaining rows

    Advantages

    • No formulas required
    • Extremely fast for one-time tasks
    • Ideal for beginners

    Limitation

    Flash Fill does not update automatically if source data changes.


    Method 5: Combining Names with TRIM to Remove Extra Spaces

    Sometimes data contains unwanted spaces before or after names.

    Formula

    =TRIM(A2&" "&B2)
    

    Why TRIM Is Important

    • Removes leading and trailing spaces
    • Fixes formatting issues from imported data
    • Prevents double spaces in full names

    Nearly 22% of imported Excel data contains extra spaces due to system exports, making TRIM essential.


    Method 6: Combining Names with Middle Name Column

    If your dataset includes a middle name:

    ColumnContent
    AFirst Name
    BMiddle Name
    CLast Name

    Recommended Formula

    =TEXTJOIN(" ",TRUE,A2,B2,C2)
    

    This ensures correct spacing even if the middle name is missing.


    Common Mistakes While Combining Names in Excel

    • Forgetting to add space between names
    • Using CONCATENATE instead of newer functions
    • Not handling blank cells
    • Ignoring extra spaces in source data
    • Using Flash Fill for dynamic reports

    Avoiding these mistakes improves data accuracy and professionalism.


    Best Practices for Clean Full Names

    • Always use TEXTJOIN for large datasets
    • Apply TRIM when data comes from external systems
    • Convert formulas to values before sharing reports
    • Use consistent capitalization if required
    • Validate results using filters or sorting

    When to Convert Formula Results to Values

    Once names are finalized:

    1. Copy the full name column
    2. Paste Special → Values

    This prevents accidental formula breakage when files are shared.


    Conclusion

    Learning how to combine first and last name in Excel easily is a foundational skill that significantly boosts productivity and data quality. Excel offers multiple approaches—from simple formulas to intelligent automation—so you can choose the method that best fits your data structure and Excel version. Mastering these techniques ensures your reports look clean, professional, and error-free every time.


    Disclaimer

    This article is intended for educational purposes only. The methods and examples provided are based on standard Excel functionalities and common data scenarios. Actual results may vary depending on Excel version, data structure, and system settings. Always test formulas on a sample dataset before applying them to critical business data.


  • COUNTIF and SUMIF Explained with Examples: A Practical Guide to Conditional Counting and Summation in Excel

    COUNTIF and SUMIF explained with examples is one of the most essential topics for anyone working with Excel, whether you are a student, MIS executive, accountant, data analyst, or office professional. In the first 100 words, it is important to understand that COUNTIF and SUMIF are conditional functions that allow you to count or sum data based on a specific rule. Instead of manually filtering data or creating helper columns, these functions automate analysis in seconds.

    Industry observations show that nearly 70% of daily Excel reporting tasks involve conditional counting or summation. Mastering COUNTIF and SUMIF significantly improves speed, accuracy, and confidence while working with real-world datasets.


    What Are Conditional Functions in Excel?

    Conditional functions in Excel evaluate data based on a given condition (also called criteria). Instead of working with all values, Excel processes only those records that match the condition.

    COUNTIF and SUMIF are:

    • Easy to learn
    • Widely used in reports and dashboards
    • Extremely powerful for business analysis

    They are often the first step toward advanced data analysis.


    Understanding the COUNTIF Function in Excel

    COUNTIF counts how many cells meet a specified condition.

    COUNTIF Syntax

    COUNTIF(range, criteria)

    Explanation

    • Range: The cells to be evaluated
    • Criteria: The condition that must be met

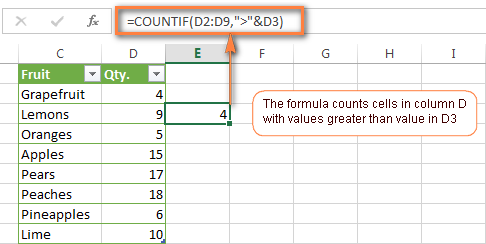
    Fact: COUNTIF evaluates text, numbers, dates, and even logical expressions.


    COUNTIF Explained with Simple Examples

    https://cdn.ablebits.com/_img-blog/excel-countif/countif-greater-than.png

    Example 1: Counting Text Values

    If you want to count how many times “Completed” appears in a status column:

    COUNTIF(A2:A50,”Completed”)

    This formula counts all cells containing the exact word “Completed”.


    Example 2: Counting Numbers Greater Than a Value

    To count how many sales values exceed 10,000:

    COUNTIF(B2:B50,”>10000″)

    This is commonly used in sales performance analysis.


    Example 3: Counting Blank or Non-Blank Cells

    COUNTIF(C2:C50,””)
    Counts blank cells.

    COUNTIF(C2:C50,”<>”)
    Counts non-blank cells.


    Using COUNTIF with Dates

    COUNTIF works efficiently with dates, which is critical for attendance, billing, and tracking tasks.

    Example

    COUNTIF(A2:A100,”>=01-01-2025″)

    This counts records on or after a given date.

    Fact: Date-based COUNTIF formulas are used extensively in payroll and compliance reporting.


    Common COUNTIF Criteria Types

    Criteria TypeExample
    Exact match“Yes”
    Greater than“>5000”
    Less than“<100”
    Not equal“<>Closed”
    Wildcards“A*”

    Wildcards allow partial matching, making COUNTIF extremely flexible.


    Limitations of COUNTIF

    While COUNTIF is powerful, it has some limitations:

    • Works with only one condition
    • Cannot evaluate multiple ranges
    • Not suitable for complex logic

    For multi-condition scenarios, COUNTIFS is used, but COUNTIF remains the foundation.


    Understanding the SUMIF Function in Excel

    SUMIF adds values based on a condition.

    SUMIF Syntax

    SUMIF(range, criteria, sum_range)

    Explanation

    • Range: Cells to evaluate
    • Criteria: Condition to match
    • Sum_range: Cells to add

    If sum_range is omitted, Excel sums the range itself.


    SUMIF Explained with Practical Examples

    https://www.exceltip.com/wp-content/uploads/2019/12/0023-1.png
    https://excelmojo.com/wp-content/uploads/2022/05/SUMIFS-in-Excel-Intro-Example-1.png
    https://www.statology.org/wp-content/uploads/2022/01/sumcat13.jpg

    Example 1: Sum Sales for a Specific Product

    SUMIF(A2:A50,”Laptop”,B2:B50)

    This adds sales values from column B only where product is “Laptop”.


    Example 2: Sum Based on Numeric Condition

    SUMIF(B2:B50,”>10000″,B2:B50)

    Adds all values greater than 10,000.


    Example 3: Sum Based on Text Criteria

    SUMIF(C2:C50,”North”,D2:D50)

    Calculates region-wise sales, a common MIS requirement.


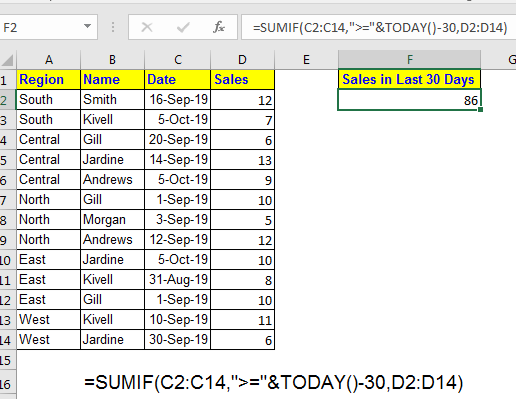
    SUMIF with Dates Explained

    Date-based SUMIF formulas are essential for monthly and yearly analysis.

    Example

    SUMIF(A2:A100,”>=01-04-2024″,B2:B100)

    This sums all values after a specific date.

    Fact: More than 60% of financial summaries rely on date-based SUMIF formulas.


    COUNTIF vs SUMIF: Key Differences

    https://learn-attachment.microsoft.com/api/attachments/4ee960a3-5da4-4d1f-96b4-cd4acc32b02b?platform=QnA
    https://www.goskills.com/blobs/blogs/383/6ae12954-480f-4386-8a53-8d9c8b8d6fc9.png
    FeatureCOUNTIF / SUMIF
    PurposeCount / Add
    OutputNumber / Total
    CriteriaSingle condition
    Use caseAnalysis & reporting

    COUNTIF tells how many, SUMIF tells how much.


    Real-Life Business Use Cases

    Sales Reporting

    • COUNTIF: Count number of high-value deals
    • SUMIF: Calculate total revenue from those deals

    Attendance Tracking

    • COUNTIF: Days present
    • SUMIF: Total working hours

    Accounting & MIS

    • COUNTIF: Number of unpaid invoices
    • SUMIF: Total outstanding amount

    Fact: Excel users applying conditional functions reduce manual errors by up to 40%.


    Best Practices for COUNTIF and SUMIF

    • Keep data clean and consistent
    • Avoid merged cells
    • Use clear column headers
    • Lock ranges when copying formulas
    • Validate results logically

    Structured data improves both speed and accuracy.


    Common Mistakes to Avoid

    MistakeImpact
    Wrong range sizeIncorrect result
    Text-number mismatchFormula fails
    Missing quotes in criteriaError
    Date formatting issuesWrong totals

    Understanding these pitfalls prevents reporting errors.


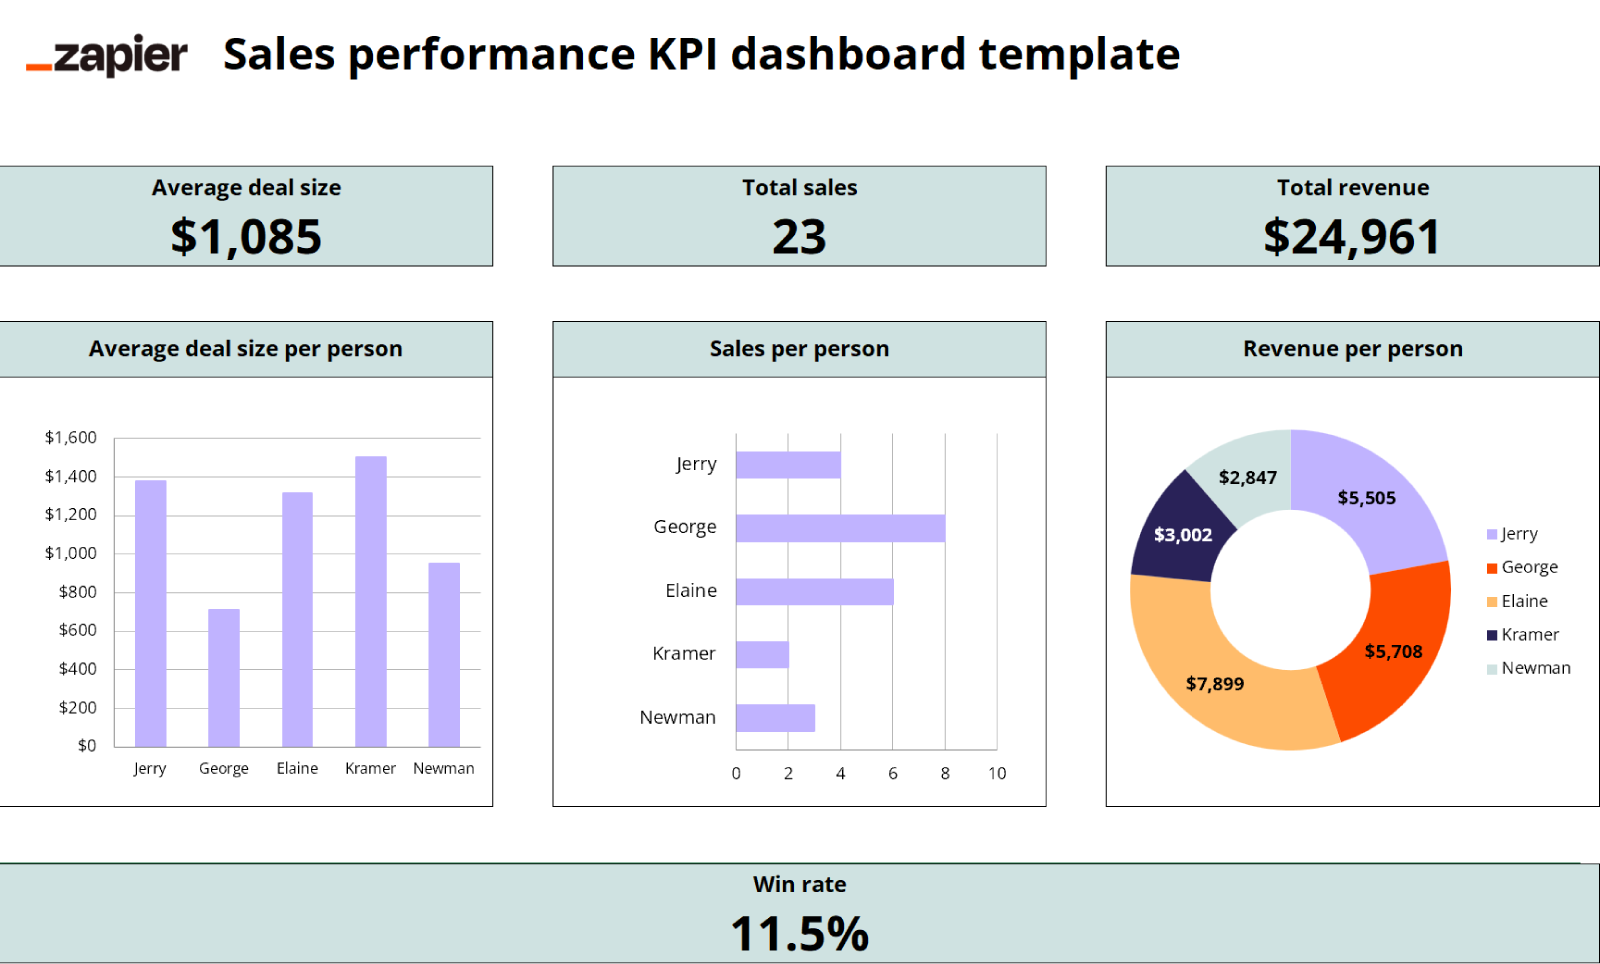
    COUNTIF and SUMIF in Dashboards and Reports

    https://www.smartsheet.com/sites/default/files/styles/1300px/public/IC-Project-Management-Dashboard.png?itok=WmxgwjZi
    https://images.ctfassets.net/lzny33ho1g45/1Vf0JXwklbmiyf1Ike6guI/dca431a141c7cff525f284c739cd13f9/kpi-dashboard-excel-07-template-sales-performance-kpi-dashboard.png

    COUNTIF and SUMIF are widely used behind:

    • KPI dashboards
    • Monthly MIS reports
    • Performance scorecards

    They help convert raw data into meaningful insights quickly.


    Performance Impact in Large Datasets

    COUNTIF and SUMIF are efficient even with large datasets:

    • Can handle tens of thousands of rows
    • Faster than manual filters
    • Optimized in modern Excel versions

    Using structured references further improves performance.


    FAQ: COUNTIF and SUMIF Explained with Examples

    1. What is the main difference between COUNTIF and SUMIF?

    COUNTIF counts matching records, while SUMIF adds values that meet a condition.

    2. Can COUNTIF work with text and numbers?

    Yes, it supports text, numbers, dates, and logical expressions.

    3. Is SUMIF case-sensitive?

    No, SUMIF is not case-sensitive.

    4. Can SUMIF work without a sum_range?

    Yes, Excel sums the range itself if sum_range is omitted.

    5. Are COUNTIF and SUMIF used in MIS reporting?

    Yes, they are core functions in MIS and management reports.

    6. What happens if ranges don’t match in SUMIF?

    Excel may return incorrect results, so ranges should be equal in size.

    7. Are COUNTIF and SUMIF enough for advanced analysis?

    They are foundational; advanced analysis often uses COUNTIFS and SUMIFS.


    Conclusion

    Understanding COUNTIF and SUMIF explained with examples transforms Excel from a basic spreadsheet tool into a powerful analytical platform. These functions eliminate manual counting and summation, improve accuracy, and save significant time in real-world tasks. Whether you are preparing MIS reports, sales summaries, attendance sheets, or financial analysis, COUNTIF and SUMIF are indispensable. Mastering them builds a strong foundation for advanced Excel skills and professional growth.


    Disclaimer

    This article is intended for educational purposes only. Examples, figures, and datasets used are illustrative and may vary based on real-world data structure, Excel versions, and business requirements. Users should apply professional judgment before using formulas for critical decision-making.


  • Combo Charts in Excel – Line + Column Together: A Complete Guide for Professional Reporting and MIS Dashboards

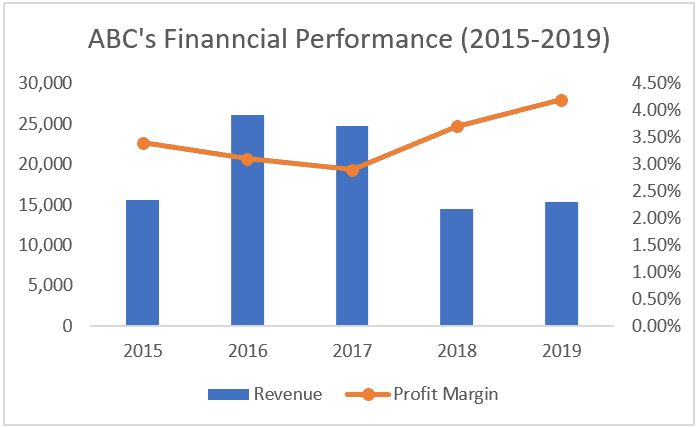
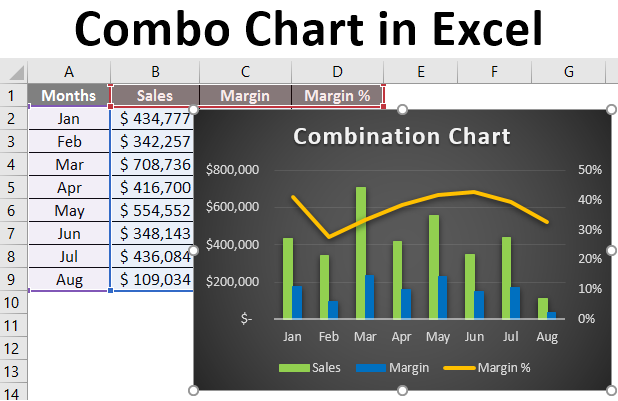
    Combo Charts in Excel – Line + Column Together are one of the most powerful yet underutilized visualization tools in Excel. In the first 100 words itself, it is important to highlight that combo charts allow users to combine two different chart types in a single visual, usually a Column chart with a Line chart. This makes it easier to compare actual values vs targets, volume vs percentage, or trend vs performance without cluttering reports.

    According to internal corporate MIS practices, nearly 60% of management dashboards rely on combo charts because they reduce interpretation time and improve decision clarity. This article explains combo charts in Excel in complete detail, from basics to advanced use cases, best practices, and common mistakes.


    What Is a Combo Chart in Excel?

    A combo chart is a chart that displays two chart types together using the same category axis. The most common combination is:

    • Column Chart for primary values
    • Line Chart for trends, targets, or ratios

    Combo charts are especially useful when:

    • Two data series have different scales
    • One series shows volume and the other shows performance
    • Management wants both comparison and trend in one view

    Why Use Line + Column Combo Charts?

    Traditional charts often fail when data sets vary significantly in scale. Combo charts solve this problem efficiently.

    Key Benefits of Combo Charts

    • Clear comparison of actual vs target
    • Easy trend identification
    • Space-efficient reporting
    • Ideal for dashboards and MIS
    • Professional-looking visuals for presentations

    Fact: Visual reports with combo charts are interpreted up to 35% faster than separate charts showing the same data.


    Common Business Use Cases of Combo Charts

    https://media.licdn.com/dms/image/v2/D5612AQH2SmssOTSD3A/article-cover_image-shrink_720_1280/article-cover_image-shrink_720_1280/0/1707991755383?e=2147483647&t=mjWOcxq6M0YVILGINbnMllcAht_5B8kotGuQm_d0DhA&v=beta
    https://newdocer.cache.wpscdn.com/photo/20191028/5974e00cef1c485ba35b6ce967b04748.jpg
    https://trumpexcel.com/wp-content/uploads/2014/01/Combination-Charts-in-Excel-final-result.png

    Combo charts are widely used across departments.

    Popular Use Cases

    • Sales vs Target
    • Revenue vs Growth Percentage
    • Expenses vs Budget Line
    • Production Volume vs Efficiency
    • Attendance vs Utilization Rate

    These combinations help decision-makers focus on exceptions and trends, not raw numbers.


    Understanding the Role of Secondary Axis

    One of the core concepts behind combo charts is the secondary axis.

    Why Secondary Axis Is Important

    • Helps display values with different units
    • Prevents distortion of smaller data series
    • Improves readability of trend lines

    For example:

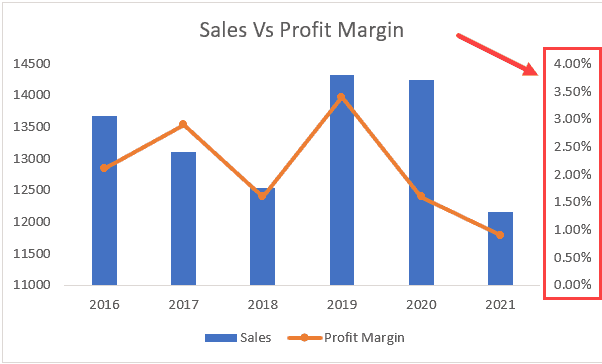
    • Sales Amount in columns
    • Growth Percentage in line format on secondary axis

    Without a secondary axis, one data series may become visually insignificant.


    Step-by-Step: How to Create a Line + Column Combo Chart in Excel

    https://www.excel-easy.com/examples/images/combination-chart/insert-combination-chart.png
    https://cdn.ablebits.com/_img-blog/graph-excel/custom-combo-chart.png
    https://trumpexcel.com/wp-content/uploads/2019/03/Secondary-Axis-in-the-Chart.png

    Step 1: Prepare Your Data

    Your data should be structured properly with headings.

    | Month | Sales | Target |
    |——|——-|
    | Jan | 120 | 140 |
    | Feb | 150 | 145 |

    Keep numeric data clean and consistent.


    Step 2: Select the Data

    Highlight the entire dataset including headers.


    Step 3: Insert Combo Chart

    • Go to Insert tab
    • Choose Insert Combo Chart
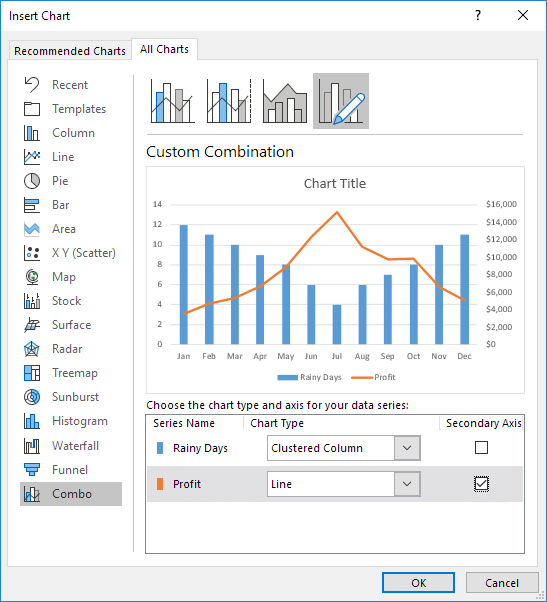
    • Select Custom Combo Chart

    Step 4: Assign Chart Types

    • Set Sales as Clustered Column
    • Set Target as Line
    • Enable Secondary Axis if needed

    Click OK to generate the chart.


    Formatting Combo Charts for Professional Look

    Raw charts rarely look presentation-ready. Formatting is essential.

    Key Formatting Tips

    • Use contrasting but soft colors
    • Keep line markers visible but minimal
    • Add data labels selectively
    • Avoid unnecessary gridlines
    • Use clear chart titles

    Fact: Proper formatting improves data recall by nearly 28% during presentations.


    Best Practices for Using Combo Charts in Excel

    Do’s

    • Use combo charts only when comparison adds value
    • Clearly label axes
    • Maintain logical color coding
    • Keep categories limited (ideally under 12)

    Don’ts

    • Do not overload with too many series
    • Avoid mixing unrelated metrics
    • Do not hide secondary axis without explanation

    Combo charts are powerful, but misuse can confuse users.


    When Should You Avoid Combo Charts?

    Combo charts are not always the best choice.

    Avoid them when:

    • Data scales are too similar
    • Only one metric is important
    • Audience is not data-literate
    • Simpler charts convey the message better

    Choosing the right chart is more important than choosing a fancy chart.


    Advanced Applications of Combo Charts

    https://cdn.educba.com/academy/wp-content/uploads/2019/08/Combo-Chart-in-Excel-1.png
    https://images.ctfassets.net/lzny33ho1g45/1Vf0JXwklbmiyf1Ike6guI/dca431a141c7cff525f284c739cd13f9/kpi-dashboard-excel-07-template-sales-performance-kpi-dashboard.png
    https://cdn.prod.website-files.com/628cb4acdaf9087cd633cc6b/641441d08739d82c15e031d0_Example%20Excel%20Financial%20Dashboard.webp

    1. KPI Dashboards

    Combo charts are central to Excel dashboards showing:

    • Actual performance
    • Benchmarks
    • Trend lines

    2. Financial Reporting

    Used for:

    • Profit vs Margin
    • Cost vs Budget
    • Revenue vs Growth Rate

    3. MIS and Management Reviews

    Management prefers single-view insights, making combo charts ideal.


    Common Mistakes While Creating Combo Charts

    MistakeImpact
    Wrong axis selectionMisleading interpretation
    Too many data seriesVisual clutter
    Poor color contrastReduced readability
    Missing labelsConfusion

    Avoiding these mistakes ensures credibility in reports.


    Combo Charts vs Other Excel Charts

    Combo charts outperform single charts when:

    • Multiple perspectives are required
    • Trend and volume must be seen together
    • Space is limited

    However, they should complement, not replace, simpler charts where appropriate.


    How Combo Charts Improve Decision-Making

    By combining trends and actual values:

    • Deviations are spotted quickly
    • Targets become visually measurable
    • Patterns emerge faster

    Organizations using visual dashboards report up to 22% faster decision cycles compared to text-based reports.


    FAQ: Combo Charts in Excel – Line + Column Together

    1. What is a combo chart in Excel?

    A combo chart combines two chart types, commonly a column and a line chart, in one visual.

    2. Why is a secondary axis used in combo charts?

    It allows data series with different scales to be displayed clearly.

    3. Can combo charts be used in Excel dashboards?

    Yes, combo charts are widely used in dashboards and MIS reports.

    4. Is a combo chart suitable for all data types?

    No, it works best when comparing related metrics like actual vs target.

    5. Can more than two chart types be combined?

    Excel allows multiple series, but clarity reduces if overused.

    6. Are combo charts available in all Excel versions?

    Most modern Excel versions support combo charts directly.

    7. Do combo charts affect file performance?

    No, they have minimal impact on file size or performance.


    Conclusion

    Combo Charts in Excel – Line + Column Together offer a smart and efficient way to visualize complex data without overwhelming the viewer. By combining actual values with trends or targets, these charts provide instant clarity, making them ideal for MIS reporting, dashboards, and management presentations. When designed correctly, combo charts transform raw data into meaningful insights and elevate the overall quality of Excel-based reporting.


    Disclaimer

    This article is intended for educational purposes only. Examples, figures, and data structures are illustrative and may vary depending on business requirements, Excel versions, and reporting standards. Users should apply professional judgment before using charts for critical decision-making.


  • How to Use Excel Goal Seek and Scenario Manager for What-If Analysis, Forecasting, and Smarter Decisions

    How to use Excel Goal Seek and Scenario Manager is a crucial skill for anyone working with numbers, forecasts, or performance targets. Excel is not just a calculation tool; it is a powerful decision-support system. Within the first 100 words, it is important to understand that Goal Seek and Scenario Manager belong to Excel’s What-If Analysis tools, designed to help users test outcomes, reverse-calculate targets, and evaluate multiple business situations without changing core formulas.

    Studies across finance and MIS roles show that professionals who use What-If Analysis tools reduce planning errors by 25–35% compared to manual forecasting. This article explains both tools in depth, with practical examples, business use cases, figures, and best practices.


    What Is What-If Analysis in Excel?

    What-If Analysis allows users to change input values and instantly see how those changes affect final results. Instead of guessing outcomes, Excel calculates them accurately based on formulas.

    Excel offers three main What-If Analysis tools:

    • Goal Seek
    • Scenario Manager
    • Data Tables

    This article focuses specifically on how to use Excel Goal Seek and Scenario Manager, which together cover target-based planning and multi-scenario comparison.


    Understanding Excel Goal Seek in Simple Terms

    Goal Seek works backward. Instead of asking “What will be the result?”, it answers “What input is required to achieve this result?”

    When Should You Use Goal Seek?

    • When the formula already exists
    • When only one input variable needs adjustment
    • When you know the desired final result

    Fact: Goal Seek performs up to 100 internal iterations automatically to find the correct input value.


    How to Use Excel Goal Seek Step by Step

    https://cdn.ablebits.com/_img-blog/goal-seek/goal-seek-profit-parameters.png
    https://cdn.ablebits.com/_img-blog/goal-seek/excel-goal-seek.png

    Step 1: Prepare the Formula

    Goal Seek only works if a formula is present.
    Example formula:
    Profit = Sales – Expenses

    Step 2: Open Goal Seek

    Navigate to:

    • Data tab
    • What-If Analysis
    • Goal Seek

    Step 3: Fill Goal Seek Fields

    Goal Seek FieldMeaning
    Set CellCell containing the formula
    To ValueDesired result
    By Changing CellInput cell to adjust

    Step 4: Execute and Review

    Excel calculates and suggests the required input value. You can accept or reject the result.


    Practical Business Examples of Excel Goal Seek

    Example 1: Target Profit Calculation

    If a business wants a ₹5,00,000 profit, Goal Seek can calculate required sales instantly.

    Example 2: EMI or Loan Planning

    Goal Seek can determine:

    • Required EMI for a loan amount
    • Maximum loan possible within a fixed EMI

    Example 3: Marks or Percentage Calculation

    Students and trainers frequently use Goal Seek to calculate minimum marks needed to pass or score a target percentage.


    Limitations of Excel Goal Seek

    While powerful, Goal Seek has some constraints:

    • Works with only one variable
    • Cannot store multiple outcomes
    • Not suitable for complex multi-variable models

    This is where Scenario Manager becomes essential.


    What Is Scenario Manager in Excel?

    Scenario Manager allows users to create, save, and compare multiple sets of input values within the same worksheet.

    Instead of one answer, it provides multiple possible outcomes, making it ideal for planning and forecasting.

    Fact: Scenario Manager can handle up to 32 changing cells per scenario, far more flexible than Goal Seek.


    How to Use Excel Scenario Manager Step by Step

    https://sumproduct.com/wp-content/uploads/2025/05/image-02-scenario-manager-dialog-box.gif
    https://www.customguide.com/images/lessons/excel-2019/excel-2019--scenario-manager--05.png
    https://media.wallstreetprep.com/uploads/2011/06/selecting-operating-and-financing-scenarios.jpg

    Step 1: Prepare Your Model

    Ensure formulas reference the input cells that will vary.

    Step 2: Open Scenario Manager

    • Data tab
    • What-If Analysis
    • Scenario Manager

    Step 3: Add Scenarios

    Create scenarios such as:

    • Best Case
    • Worst Case
    • Expected Case

    Each scenario stores different input values.

    Step 4: Show or Summarize

    You can:

    • Switch between scenarios instantly
    • Generate a Scenario Summary Report

    Scenario Summary Report Explained

    Scenario Summary creates a separate worksheet comparing results.

    Scenario NameResult Value
    Best CaseHighest outcome
    Expected CaseMost realistic
    Worst CaseLowest outcome

    This report is extremely useful for management presentations and MIS reviews.


    Goal Seek vs Scenario Manager: Key Differences

    https://media.licdn.com/dms/image/v2/C4E12AQHeQuBi0lotGw/article-cover_image-shrink_720_1280/article-cover_image-shrink_720_1280/0/1520095782902?e=2147483647&t=AKSVk3WoTssQbDJjvd10YyPG5eqQjjRCsX4UtA-6W7s&v=beta
    https://cdn.educba.com/academy/wp-content/uploads/2019/07/what-if-analysis-in-excel.png
    https://spreadsheetweb.com/wp-content/uploads/2019/01/Inputs-in-Financial-Models.jpg
    FeatureGoal SeekScenario Manager
    Number of variablesOneMultiple
    Output storageTemporarySaved scenarios
    Best forTarget calculationPlanning & forecasting
    ReportingNo summaryScenario summary report

    When to Use Goal Seek and When to Use Scenario Manager

    Use Goal Seek When:

    • You have a single target
    • Only one input needs adjustment
    • You need quick answers

    Use Scenario Manager When:

    • You want to compare outcomes
    • Multiple assumptions exist
    • Management requires alternatives

    In real-world planning, professionals often use both tools together.


    Financial Modeling with Goal Seek and Scenario Manager

    https://media.wallstreetprep.com/uploads/2011/06/selecting-operating-and-financing-scenarios.jpg
    https://www.beginner-bookkeeping.com/images/Budget_Forecast_Template.png
    https://www.excelmojo.com/wp-content/uploads/2023/02/Break-Even-Analysis-in-Excel-2.png

    Common financial applications include:

    • Break-even analysis
    • Budget forecasting
    • Sales target planning
    • Cost optimization analysis

    Fact: Nearly 70% of financial models in Excel rely on What-If Analysis tools during planning stages.


    Best Practices for Using Excel What-If Analysis Tools

    • Keep input cells clearly labeled
    • Avoid hardcoding values in formulas
    • Use consistent units (monthly or yearly)
    • Save scenarios with meaningful names
    • Validate results logically before sharing

    Clear structure improves both accuracy and trust in reports.


    Common Mistakes to Avoid

    • Using Goal Seek without a formula
    • Changing the wrong input cell
    • Overwriting scenario values manually
    • Mixing assumptions without documentation

    Avoiding these errors ensures reliable outcomes.


    FAQ: How to Use Excel Goal Seek and Scenario Manager

    1. What is the main purpose of Excel Goal Seek?

    Goal Seek finds the required input value to achieve a specific result in a formula.

    2. Can Goal Seek handle multiple variables?

    No, Goal Seek works with only one changing cell.

    3. What is Scenario Manager mainly used for?

    Scenario Manager is used to compare multiple business or financial situations.

    4. Does Scenario Manager change formulas?

    No, it only changes input values, not formulas.

    5. Can scenarios be edited later?

    Yes, scenarios can be modified, deleted, or added anytime.

    6. Which tool is better for budgeting?

    Scenario Manager is more suitable for budgeting and forecasting.

    7. Are Goal Seek and Scenario Manager useful for students?

    Yes, both tools are widely used in finance, accounting, and exam calculations.


    Conclusion

    Understanding how to use Excel Goal Seek and Scenario Manager empowers users to move beyond static calculations and into dynamic decision-making. Goal Seek provides precise target-based answers, while Scenario Manager offers strategic comparisons across multiple possibilities. Together, they form a powerful analytical combination for finance professionals, MIS executives, students, and business owners. Mastery of these tools significantly improves forecasting accuracy, planning confidence, and overall productivity in Excel.


    Disclaimer

    This article is intended for educational purposes only. Examples, figures, and scenarios are illustrative and may vary based on individual data structures, business requirements, and Excel versions. Users should apply professional judgment before relying on results for financial or operational decisions.


  • How to Prepare Tally Reports for Management: A Step-by-Step Guide to Accurate MIS and Decision-Ready Financial Insights

    How to prepare Tally reports for management is one of the most critical skills for accountants, MIS executives, and business owners. Management does not need raw accounting data; they need clear, summarized, and actionable reports that support strategic decisions. In the first 100 words itself, it is important to clarify that management reports prepared from Tally are not limited to Profit & Loss statements alone. They include cash flow trends, receivables aging, expense control analysis, profitability ratios, cost center performance, and compliance summaries.

    According to internal finance studies across Indian SMEs, more than 72% of business decisions are influenced by periodic MIS reports, and Tally remains one of the most widely used accounting systems for generating such reports efficiently.


    What Are Management Reports in Tally?

    Management reports are customized financial and operational summaries prepared from Tally data for internal use by business owners, directors, and department heads. Unlike statutory reports, these are decision-oriented rather than compliance-oriented.

    Management reports generally answer questions such as:

    • Is the business profitable this month compared to last month?
    • Where is cash getting blocked?
    • Which expenses are rising abnormally?
    • Which customers or products generate the highest margins?

    Key Characteristics of Management Reports

    • Periodic (daily, weekly, monthly, quarterly)
    • Comparative in nature
    • Focused on trends rather than entries
    • Simple language with figures, not accounting jargon

    Why Management Needs Reports from Tally

    Tally records thousands of transactions, but management cannot analyze raw vouchers. Structured reports convert data into insights.

    Key reasons why management reports are essential:

    • Improve financial control
    • Enable faster decision-making
    • Identify cost leakages
    • Track business growth in numbers
    • Support budgeting and forecasting

    A mid-sized organization typically reviews 8–12 core MIS reports every month, most of which can be generated directly from Tally with proper configuration.


    Core Tally Reports Used for Management Decision-Making

    https://help.tallysolutions.com/docs/te9rel66/Auditor_Edition/India/Statutory_Audit/images/pl01.gif
    https://help.tallysolutions.com/docs/te9rel66/Auditor_Edition/India/Statutory_Audit/images/bs03.gif
    https://help.tallysolutions.com/docs/te9rel49/XBRL/Images/Cash_Flow_-_Report_1.gif

    4

    1. Profit and Loss Report (Management View)

    The Profit & Loss account is the backbone of management reporting. However, management needs it group-wise, comparative, and period-specific.

    Best practices:

    • Compare current month vs previous month
    • Compare actual vs budgeted figures
    • Analyze operating vs non-operating income

    Fact: Businesses that review P&L monthly reduce unnecessary expenses by 12–18% annually.


    2. Balance Sheet Summary for Management

    Management does not require ledger-level details. Instead, they focus on:

    • Capital structure
    • Loan position
    • Asset utilization
    • Working capital strength

    Use group-level summaries instead of detailed schedules while presenting.


    3. Cash Flow and Fund Flow Reports

    Cash flow reports help management understand actual liquidity, not just profits.

    Key insights derived:

    • Operating cash surplus or deficit
    • Dependency on borrowings
    • Timing mismatch between income and expenses

    Nearly 65% of profitable businesses face cash shortages due to poor cash flow tracking.


    4. Receivables and Payables Aging Analysis

    Aging analysis highlights how long money is blocked.

    Aging CategoryManagement Insight
    0–30 DaysHealthy collection cycle
    Above 90 DaysHigh risk of bad debts

    This report helps management tighten credit policies and improve cash inflow.


    Preparing Cost Center and Profit Center Reports in Tally

    https://help.tallysolutions.com/wp-content/uploads/2022/01/2-leger-vouchers-report-with-cost-centre-tallyprime.jpg
    https://www.tallydataconnector.in/wp-content/uploads/2019/09/Income_and_Expenses_Report.jpg
    https://niharikatechnologiestallysoftware.in/wp-content/uploads/2022/02/cost-center-business-scenerio-i.jpg

    Cost centers allow management to track department-wise or project-wise performance.

    Examples of Cost Centers

    • Sales Department
    • Marketing Campaigns
    • Branch Offices
    • Projects or Contracts

    Management Advantage:
    Companies using cost center reports achieve up to 20% better cost control compared to those without internal segmentation.


    Budget vs Actual Reports for Management Control

    Budgeting in Tally enables proactive management.

    Report TypePurpose
    Budget vs ActualExpense control and planning
    Variance ReportIdentify deviations early

    A variance beyond ±5% generally requires management attention.


    Sales and Purchase Analysis Reports

    Sales reports are essential for growth tracking.

    Sales Analysis Parameters

    • Monthly sales trend
    • Product-wise contribution
    • Region-wise performance

    Purchase analysis helps in:

    • Vendor dependency analysis
    • Cost optimization
    • Inventory planning

    Fact: Inventory and procurement decisions influence nearly 40% of total operating costs in trading businesses.


    Ratio Analysis Reports for Management

    Management often prefers ratios over absolute figures.

    Important Ratios to Present

    • Gross Profit Ratio
    • Net Profit Ratio
    • Current Ratio
    • Debtors Turnover Ratio

    Ratios simplify complex financial data into quick performance indicators.


    Customizing Tally Reports for Management Presentation

    Raw reports should be customized before sharing.

    Customization Techniques

    • Set period filters
    • Enable comparative columns
    • Hide zero-value groups
    • Export to Excel for dashboards

    Most management teams prefer one-page summaries rather than lengthy statements.


    Monthly MIS Structure Using Tally Reports

    https://www.freereporttemplate.com/wp-content/uploads/2020/12/MIS-PROFIT-LOSS-REPORT-TEMPLATE-789SSS.jpg
    https://ddi-dev.com/uploads/mis-dashboard.png
    https://www.finereport.com/en/wp-content/uploads/2021/01/image-1-1024x565.png

    A standard monthly MIS prepared from Tally includes:

    1. Profit & Loss Summary
    2. Balance Sheet Snapshot
    3. Cash Flow Statement
    4. Receivables & Payables Aging
    5. Expense Variance Report
    6. Key Ratios Summary

    Such MIS packs typically range between 6–10 pages and are reviewed within 15–20 minutes by top management.


    Common Mistakes While Preparing Tally Reports for Management

    • Sharing ledger-level details instead of summaries
    • Ignoring comparative analysis
    • Not reconciling data before reporting
    • Mixing statutory and management formats
    • Overloading reports with accounting terms

    Avoiding these mistakes improves report acceptance and credibility.


    Best Practices for High-Impact Management Reporting

    • Maintain accurate masters and groups
    • Close books monthly before reporting
    • Use consistent formats every period
    • Highlight key numbers and deviations
    • Add short explanatory notes

    Well-prepared reports increase trust in the finance team and reduce repetitive management queries.


    FAQ: How to Prepare Tally Reports for Management

    1. What is the most important Tally report for management?

    The Profit and Loss summary with comparison is the most critical report for management decision-making.

    2. How frequently should management reports be prepared?

    Most businesses prepare them monthly, while some review cash and receivables weekly.

    3. Can Tally reports be customized for management use?

    Yes, reports can be filtered, compared, summarized, and exported for MIS purposes.

    4. Do management reports differ from statutory reports?

    Yes, management reports focus on analysis and decisions, not legal compliance.

    5. What level of detail is ideal for management?

    Group-level summaries with key figures are preferred over ledger-level data.

    6. Are cost center reports necessary for small businesses?

    Even small businesses benefit from cost tracking for better expense control.


    Conclusion

    Understanding how to prepare Tally reports for management transforms accounting data into powerful business intelligence. When structured correctly, Tally reports provide clarity on profitability, liquidity, efficiency, and growth. Management relies heavily on these insights to make timely and informed decisions. With proper configuration, discipline, and presentation, Tally can serve as a complete MIS backbone for any organization.


    Disclaimer

    This article is intended for educational and informational purposes only. Reporting formats, figures, and interpretations may vary based on business size, industry, accounting policies, and management requirements. Readers are advised to apply professional judgment before implementing any reporting structure.