Category: Computer Skills

  • Interview Questions for Tally and GST Profiles: Complete Job-Oriented Guide for Accounts & Tax Roles

    Interview Questions for Tally and GST Profiles are among the most searched topics by commerce graduates, accountants, and job seekers preparing for accounts executive, GST executive, and junior accountant roles. In India, more than 70 percent of small and mid-sized businesses rely on Tally-based accounting and GST compliance, which makes recruiters highly focused on practical knowledge rather than theory alone. If you are preparing for an interview in accounts, taxation, or compliance, understanding both Tally operations and GST rules is essential.

    This in-depth guide covers frequently asked interview questions for Tally and GST profiles, categorized by difficulty level and job role. It also includes practical explanations, figures, and real-world insights so you can answer confidently and professionally.


    Why Tally and GST Skills Are Critical for Accounting Jobs

    India has over 1.4 crore GST-registered businesses, and a majority of them use accounting software for compliance. Tally continues to dominate the SME accounting segment because of its simplicity, GST readiness, and reporting flexibility.

    What Interviewers Expect from Candidates

    ExpectationPractical Meaning
    Accounting fundamentalsStrong debit-credit clarity
    Tally proficiencyHands-on voucher and ledger work
    GST compliance knowledgeAccurate returns and tax calculation
    Data accuracyError-free entries and reconciliations

    Recruiters increasingly prefer candidates who can execute tasks independently from Day 1, especially for GST filings and monthly accounts closing.


    Basic Interview Questions for Tally Profiles

    These questions are commonly asked for junior accountant, accounts assistant, and fresher-level roles.

    What is Tally and where is it used?

    Tally is an accounting software used for recording financial transactions, maintaining ledgers, preparing financial statements, managing inventory, and complying with taxation requirements such as GST.

    What are the main accounting groups in Tally?

    Tally has predefined groups such as Capital Account, Current Assets, Current Liabilities, Direct Expenses, Indirect Expenses, Direct Income, and Indirect Income.

    What is a ledger in Tally?

    A ledger is an individual account used to record transactions related to a specific person, asset, liability, income, or expense.

    Difference between voucher and ledger

    VoucherLedger
    Transaction entry screenAccount-wise record
    Used for data entryUsed for reporting

    Practical Tally Interview Questions (Most Important)

    These questions test hands-on working knowledge, not definitions.

    How do you create a company in Tally?

    A company is created by entering basic details such as company name, address, financial year, and maintaining accounts option.

    What are accounting vouchers in Tally?

    Accounting vouchers are used to record transactions. Common vouchers include Payment, Receipt, Contra, Journal, Sales, and Purchase.

    Difference between Payment voucher and Contra voucher

    Payment VoucherContra Voucher
    Cash or bank paymentCash to bank or bank to bank
    Affects expenseNo expense impact

    How do you pass a journal entry in Tally?

    Journal vouchers are used for non-cash transactions such as depreciation, provisions, and adjustments.


    GST Interview Questions for Accounts and Tax Profiles

    GST-related questions are compulsory for most accounting interviews today.

    What is GST?

    Goods and Services Tax is an indirect tax levied on the supply of goods and services in India. It replaced multiple indirect taxes like VAT, Service Tax, and Excise Duty.

    Types of GST in India

    GST TypeApplicable Area
    CGSTIntra-state supply
    SGSTIntra-state supply
    IGSTInter-state supply

    What is GSTIN?

    GSTIN is a 15-digit unique identification number allotted to every registered taxpayer under GST.


    Tally with GST Interview Questions (Very Frequently Asked)

    These questions test integration of accounting and taxation.

    How is GST enabled in Tally?

    GST is enabled by activating statutory features and entering GST registration details such as GSTIN, state, and tax type.

    How do you record a GST sales invoice in Tally?

    A GST sales invoice includes party ledger, item details, taxable value, GST rate, CGST/SGST or IGST, and total invoice value.

    How is input tax credit recorded?

    Input tax credit is recorded by booking purchase invoices with correct GST classification and tax ledgers.

    Common GST Mistakes Interviewers Ask About

    MistakeImpact
    Wrong GST rateExcess or short tax
    Incorrect GSTINITC rejection
    Missing HSNReturn mismatch

    GST Returns Interview Questions

    GST returns are critical for compliance roles.

    What is GSTR-1?

    GSTR-1 is a monthly or quarterly return that captures details of outward supplies.

    What is GSTR-3B?

    GSTR-3B is a summary return used to declare tax liability and claim input tax credit.

    Due dates recruiters expect you to know

    ReturnTypical Due Date
    GSTR-111th of next month
    GSTR-3B20th of next month

    Advanced Interview Questions for Experienced Profiles

    These are asked for GST executive, senior accountant, and compliance roles.

    What is reverse charge mechanism?

    Under RCM, the recipient of goods or services is liable to pay GST instead of the supplier.

    What is e-invoice and when is it applicable?

    E-invoicing is mandatory for businesses above a specified turnover limit, where invoices are authenticated through the government portal.

    How do you handle GST reconciliation?

    GST reconciliation involves matching books with GSTR-2B, GSTR-1, and GSTR-3B to identify mismatches.


    Scenario-Based Interview Questions (Highly Valued)

    Interviewers often test decision-making ability.

    What will you do if ITC is not reflecting in GSTR-2B?

    You should follow up with the supplier, verify invoice details, and claim ITC only after reflection.

    How do you correct a wrong GST entry in Tally?

    Entries are corrected by editing vouchers or passing adjustment entries before return filing.


    Skills Interviewers Look for Beyond Questions

    SkillImportance
    AccuracyZero tolerance for GST errors
    Compliance awarenessAvoid penalties
    Excel knowledgeData reconciliation
    DocumentationAudit readiness

    Frequently Asked Questions (FAQ)

    What are the most common interview questions for Tally and GST profiles?

    Questions related to vouchers, GST returns, ITC, and practical transaction entries are most common.

    Is GST knowledge mandatory for Tally jobs?

    Yes. Most accounting roles now require working knowledge of GST along with Tally.

    How much GST knowledge is enough for a fresher?

    Understanding GST basics, returns, and invoice booking is sufficient for entry-level roles.

    Do interviewers ask practical Tally questions?

    Yes. Many interviews include scenario-based or software-related questions.

    Which GST return is most important for interviews?

    GSTR-3B is the most important due to its tax payment relevance.

    Is Excel required along with Tally and GST?

    Yes. Excel is widely used for reconciliation, reporting, and MIS work.


    Final Thoughts

    Preparing for Interview Questions for Tally and GST Profiles requires more than memorizing definitions. Recruiters value candidates who understand real-world accounting scenarios, GST compliance flow, and error handling. Strong fundamentals combined with practical exposure significantly improve job readiness and salary potential in accounting and taxation roles.


    Disclaimer

    This article is intended for educational and informational purposes only. Tax laws, GST rules, and compliance requirements are subject to change. Readers are advised to verify current regulations and seek professional guidance before applying concepts in real business or compliance scenarios.


  • Best Laptops for Students Learning Excel & Tally in India (2026 Buying Guide)

    Choosing the right laptop is a critical decision for students who are learning Excel and Tally for accounting, GST, MIS reporting, and office careers. Unlike gaming or design workloads, Excel and Tally demand speed, stability, multitasking capability, and long-term reliability. A slow or underpowered laptop can directly affect practice efficiency, software responsiveness, and learning confidence.

    This detailed guide on the best laptops for students learning Excel & Tally is written specifically for Indian learners, commerce students, job seekers, and working professionals. It focuses on real-world usage such as large Excel files, pivot tables, formulas, GST entries, reports, and day-to-day accounting tasks—without unnecessary hype.


    What Students Really Need for Excel & Tally

    Before reviewing specific models, it is important to understand what actually matters for Excel and Tally usage.

    Recommended Minimum Specifications

    ComponentPractical Recommendation
    ProcessorIntel Core i3 (latest gen) or higher
    RAM12 GB minimum, 16 GB ideal
    Storage512 GB SSD or more
    DisplayFull HD (1920×1080), IPS preferred
    OSWindows 11 (64-bit)

    Excel performance depends heavily on RAM and CPU efficiency, especially when working with formulas, pivot tables, and multiple sheets. Tally benefits from fast SSD storage and system stability rather than high-end graphics.


    Acer Aspire Lite (12th Gen Core i5) – Best Performance-to-Price Option

    The Acer Aspire Lite with a 12th Gen Intel Core i5-12450H processor is a strong option for students who want speed and future-proofing without crossing into premium pricing.

    Practical Performance for Excel & Tally

    • Handles large Excel workbooks smoothly
    • Fast calculation of formulas and pivot tables
    • Tally runs effortlessly even with multi-company data
    • Suitable for multitasking (Excel + browser + PDF + Tally)

    Key Strengths

    • High-performance H-series processor
    • 16 GB RAM is ideal for Excel power users
    • Full HD IPS display improves long study sessions
    • Backlit keyboard helps during late-night practice

    Limitations

    • Battery life is average
    • Not designed for gaming or heavy graphics

    Recommended for: Serious learners, accounting students, and professionals planning long-term use.

    Buy Here


    HP 15 (13th Gen Core i3) – Best Budget Laptop for Beginners

    This HP 15 model with a 13th Gen Intel Core i3 processor is well-suited for beginners starting their journey with Excel and Tally.

    Practical Performance for Excel & Tally

    • Smooth performance for basic and intermediate Excel tasks
    • Suitable for Tally accounting and GST practice
    • Works well for online classes and assignments

    Key Strengths

    • Latest-generation processor
    • Lightweight and easy to carry
    • Good keyboard layout for data entry
    • Preloaded office tools for students

    Limitations

    • 12 GB RAM is sufficient but not ideal for heavy Excel files
    • Not meant for advanced multitasking

    Recommended for: Beginners, commerce students, and budget-conscious learners.

    Check Price Here


    HP 15 (Intel Core Ultra 5) – Best Premium Choice for Advanced Users

    The HP 15 with Intel Core Ultra 5 processor is designed for users who want top-tier performance, advanced multitasking, and longer system life.

    Practical Performance for Excel & Tally

    • Extremely fast Excel calculations
    • Effortless handling of large MIS reports
    • Ideal for professionals managing multiple datasets
    • Stable performance during long accounting sessions

    Key Strengths

    • 16 GB DDR5 RAM ensures long-term relevance
    • Massive 1 TB SSD for data storage
    • Excellent Full HD IPS display
    • AI-optimized processor for efficiency

    Limitations

    • Higher price compared to student models
    • Overpowered for basic Excel-only users

    Recommended for: Advanced learners, working professionals, and MIS-heavy roles.

    Buy Here


    Quick Comparison for Excel & Tally Students

    Laptop ModelBest Use Case
    Acer Aspire Lite i5Performance-focused learning
    HP 15 Core i3Budget-friendly beginner option
    HP 15 Core Ultra 5Advanced and professional workloads

    Which Laptop Should You Choose for Excel & Tally

    • Choose Acer Aspire Lite if you want maximum performance per rupee and plan to work with large Excel files.
    • Choose HP 15 Core i3 if you are just starting and want a reliable, affordable system.
    • Choose HP 15 Core Ultra if you are already working or plan to move into advanced accounting, MIS, or analytics roles.

    All three laptops meet the core requirements for Excel and Tally, but your choice should depend on workload intensity and long-term goals.


    Frequently Asked Questions (FAQs)

    Is 8 GB RAM enough for Excel and Tally?

    8 GB can work for basic tasks, but 12–16 GB is strongly recommended for smooth Excel performance.

    Do I need a dedicated graphics card for Tally?

    No. Tally and Excel do not require dedicated graphics.

    Is SSD necessary for accounting students?

    Yes. SSD significantly improves speed, software loading, and system responsiveness.

    Can Excel and Tally run on Windows 11?

    Yes. Both work smoothly on Windows 11 (64-bit).

    Which processor is better for Excel, i3 or i5?

    An i5 processor performs better for large datasets and multitasking.


    Final Verdict

    The best laptops for students learning Excel & Tally are those that balance performance, reliability, and value. Investing in a good processor, sufficient RAM, and SSD storage will directly enhance learning speed and productivity.

    Choose based on your current level and future plans, not just price.


    Disclaimer

    This article is for informational purposes only. Prices, availability, and specifications may change over time. Purchase decisions should be made based on individual needs and official product details.


  • Job-Oriented Excel + Tally Course Bundle: Complete Practical Training for Accounts, GST, and Office Careers

    In today’s competitive job market, employers are no longer satisfied with just academic degrees. They look for job-ready skills that can be applied from day one. This is where a Job-Oriented Excel + Tally Course Bundle becomes extremely valuable. This bundle is designed for students, fresh graduates, job seekers, and working professionals who want strong practical knowledge of accounting, taxation, and data management using Excel and Tally.

    The Job-Oriented Excel + Tally Course Bundle focuses on real-world accounting scenarios, GST compliance, MIS reporting, and day-to-day office work. Instead of theoretical concepts, this training emphasizes hands-on practice, industry workflows, and problem-solving skills that companies actively demand.


    Why a Job-Oriented Excel + Tally Course Bundle Is in High Demand

    Accounting and data-handling roles exist in almost every industry—manufacturing, trading, services, e-commerce, logistics, and finance. Surveys in the Indian job market show that:

    • Over 70% of small and medium businesses use Tally for accounting
    • More than 90% of office-based roles require Excel skills
    • Candidates with Excel + Tally skills get shortlisted faster for junior accounting and MIS roles

    This makes a job-oriented Excel and Tally course bundle a powerful combination for career growth.


    What Makes This Excel + Tally Course Bundle Job-Oriented

    Unlike generic courses, this bundle is structured around practical job roles, not just software features. The training simulates actual office tasks such as voucher entry, GST returns, reconciliation, payroll basics, and management reports.

    Key job-oriented aspects include:

    • Practical assignments based on real business cases
    • Step-by-step workflows followed in companies
    • Focus on accuracy, speed, and compliance
    • Coverage of both accounting logic and software execution

    Course Structure Overview

    The Job-Oriented Excel + Tally Course Bundle is divided into two major skill tracks that complement each other perfectly.

    Excel Training Module

    Excel is the backbone of reporting and data analysis in offices. This module covers Excel from a beginner to an advanced professional level.

    Topics include:

    • Excel interface, formatting, and shortcuts
    • Data entry techniques for speed and accuracy
    • Logical formulas used in accounting work
    • Lookup and reference functions
    • Date, time, and text functions
    • Data validation and error handling
    • Pivot tables for MIS reports
    • Charts and dashboards for management

    Tally Training Module

    Tally is widely used for accounting, taxation, and compliance. This module focuses on practical accounting processes.

    Topics include:

    • Company creation and configuration
    • Ledger and group creation
    • Voucher entry for sales, purchase, payment, and receipt
    • GST configuration and compliance
    • Input tax credit and tax liability calculation
    • GST returns basics and reports
    • Trial balance, profit & loss, and balance sheet
    • Data backup and security practices

    Skills You Gain from the Job-Oriented Excel + Tally Course Bundle

    This bundle equips learners with employable skills, not just software knowledge.

    Skill AreaPractical Outcome
    AccountingHandle day-to-day business accounts independently
    ExcelCreate MIS reports, summaries, and dashboards
    GSTUnderstand taxation workflow and compliance basics
    Data AccuracyReduce errors and improve reporting quality

    Who Should Enroll in This Course Bundle

    This job-oriented Excel + Tally training is ideal for:

    • Commerce students and graduates
    • Non-commerce students entering accounting roles
    • Job seekers aiming for accounts executive positions
    • Small business owners managing their own accounts
    • Working professionals looking to upskill

    No advanced technical background is required. Basic computer knowledge is sufficient.


    Real-World Job Roles You Can Target After Completion

    After completing the Job-Oriented Excel + Tally Course Bundle, learners become suitable for multiple entry- and mid-level roles.

    Job RoleTypical Responsibilities
    Accounts ExecutiveVoucher entry, ledgers, reports
    Junior AccountantDay-to-day accounting and GST
    MIS ExecutiveExcel-based reports and analysis
    Office AccountantEnd-to-end accounting operations

    These roles exist across industries, making the skillset highly transferable.


    How Excel and Tally Work Together in Real Offices

    In real companies, Excel and Tally are not used separately—they work together.

    Common workflows include:

    • Importing data from Tally into Excel for analysis
    • Preparing MIS reports in Excel using accounting data
    • Reconciling sales, purchase, and GST data
    • Sharing Excel reports with management

    This course bundle trains learners to bridge the gap between accounting software and reporting tools.


    Learning Outcomes and Measurable Benefits

    By the end of the Job-Oriented Excel + Tally Course Bundle, learners typically achieve:

    • 2x faster data handling compared to manual methods
    • Improved confidence in accounting discussions
    • Ability to manage small business accounts independently
    • Strong foundation for advanced accounting or taxation courses

    These outcomes directly improve employability.


    Practical Assignments and Case-Based Learning

    One of the strongest features of this bundle is its practical approach.

    Learners work on:

    • Sample business accounting data
    • GST-based sales and purchase cases
    • Excel-based MIS and summary reports
    • Error identification and correction scenarios

    This mirrors real office challenges and prepares learners for interviews and on-the-job tasks.


    Career Growth After Excel + Tally Training

    This course bundle is not just about getting a first job. It also supports long-term career growth.

    With experience, learners can progress to:

    • Senior Accountant roles
    • MIS and reporting specialists
    • Accounts supervisors
    • Freelance accounting and GST support roles

    Excel and Tally skills also serve as a base for learning advanced tools like ERP systems and financial analytics.


    Why This Job-Oriented Excel + Tally Course Bundle Stands Out

    • Focus on practical job skills
    • Structured learning path
    • Industry-relevant examples
    • Balanced coverage of accounting and reporting
    • Suitable for beginners and professionals

    This makes it a strong choice for anyone serious about building a career in accounts and office administration.


    Frequently Asked Questions (FAQs)

    What is a job-oriented Excel + Tally course bundle?

    A job-oriented Excel + Tally course bundle focuses on practical accounting and reporting skills required in real office jobs rather than only theoretical concepts.

    Can beginners join this Excel and Tally course bundle?

    Yes, the course is designed for beginners and starts from basic concepts before moving to advanced practical applications.

    How does Excel help in accounting jobs?

    Excel is used for MIS reports, data analysis, reconciliation, summaries, and management dashboards in accounting roles.

    Is this course useful for GST-related jobs?

    Yes, the Tally module includes GST configuration, tax calculation, and compliance basics required for entry-level GST work.

    What jobs can I apply for after completing this course?

    You can apply for roles such as accounts executive, junior accountant, MIS executive, and office accountant.

    Does this course help in interviews?

    Yes, practical knowledge and real-case exposure significantly improve interview performance and confidence.


    Final Thoughts

    A Job-Oriented Excel + Tally Course Bundle is one of the most practical and cost-effective ways to enter or grow in the accounting and office domain. With strong demand across industries, these skills provide stability, growth, and long-term career opportunities.


    Course Access and Enrollment Details

    Readers who wish to enroll in the Job-Oriented Excel + Tally Course Bundle can access the official course page using the course link below. This link leads directly to the complete training program, including all modules, practical lessons, and downloadable resources.

    Course Access Link (Official)

    Visual Overview of the Course Content

    To help learners better understand what they will study, the course is typically structured visually around:

    • Excel worksheets with formulas, pivot tables, and dashboards
    • Tally accounting screens for voucher entry and GST configuration
    • Realistic business data used for practice and assignments
    • Reports such as Profit & Loss, Balance Sheet, and MIS summaries

    These visuals help bridge the gap between theory and real-world accounting work, making the learning process easier and more engaging for beginners as well as professionals.


    Disclaimer

    This article is for educational and informational purposes only. Career outcomes depend on individual effort, practice, prior knowledge, and market conditions. Software features and industry requirements may change over time.


  • Create Interactive Chart Dashboard in Excel: A Step-by-Step Guide for Dynamic Business Reporting

    Learning how to Create Interactive Chart Dashboard in Excel is one of the most valuable skills for professionals working with data, reports, and management presentations. An interactive Excel dashboard transforms static charts into dynamic visuals that respond instantly to user selections such as filters, slicers, and drop-down lists.

    In the first 100 words itself, it is important to highlight that creating an interactive chart dashboard in Excel allows decision-makers to analyze trends, compare performance, and drill down into data without modifying formulas or sheets. Instead of creating multiple reports, a single interactive dashboard can answer dozens of business questions in real time.

    This detailed guide explains how to create an interactive chart dashboard in Excel from scratch, covering concepts, structure, tools, step-by-step workflow, best practices, performance facts, and real-world use cases.


    What Is an Interactive Chart Dashboard in Excel?

    An interactive chart dashboard in Excel is a single-screen visual report that combines charts, tables, and controls to present key insights dynamically.

    Key Characteristics of an Interactive Dashboard

    FeatureExplanation
    Dynamic ChartsChange automatically based on selection
    User ControlsSlicers, drop-downs, timelines
    Real-Time UpdatesNo manual refresh
    Single ViewOne-page summary

    Unlike static charts, interactive dashboards allow users to explore data without editing the worksheet.


    Why Create Interactive Chart Dashboard in Excel?

    Creating an interactive chart dashboard in Excel improves efficiency, clarity, and decision-making speed.

    Business Benefits

    BenefitImpact
    Faster AnalysisSaves reporting time
    Better DecisionsVisual insights
    Reduced ErrorsNo manual filtering
    Professional ReportsManagement-ready

    Studies across corporate training programs show that dashboards reduce reporting preparation time by 60–75% compared to manual reporting.


    Types of Interactive Charts Used in Excel Dashboards

    Chart TypeBest Use
    Column ChartCategory comparison
    Line ChartTrends over time
    Bar ChartRanking analysis
    Pie / DonutShare distribution
    Combo ChartMulti-metric analysis

    Selecting the correct chart type is critical for dashboard effectiveness.


    Tools Required to Create Interactive Chart Dashboard in Excel

    Core Excel Features Used

    ToolPurpose
    Pivot TablesData summarization
    Pivot ChartsDynamic visuals
    SlicersInteractive filters
    TimelinesDate-based filtering
    Form ControlsAdvanced interactivity

    No external add-ins are required to build professional dashboards.


    Step 1: Prepare the Source Data Properly

    The foundation of any interactive chart dashboard in Excel is clean, structured data.

    Data Preparation Rules

    RuleReason
    Use Excel TablesAuto-expansion
    No Blank RowsConsistent analysis
    Proper HeadersField recognition
    Consistent Data TypesAvoid errors

    Well-prepared data improves dashboard performance by nearly 50%.


    Step 2: Convert Data into Pivot Tables

    Pivot Tables act as the engine behind interactive dashboards.

    Why Pivot Tables Are Essential

    FeatureAdvantage
    AggregationInstant summaries
    FilteringDynamic control
    ScalabilityHandles large data

    Each chart in the dashboard should ideally be connected to a Pivot Table.


    Step 3: Create Pivot Charts for Dashboard Visuals

    Once Pivot Tables are ready, convert them into Pivot Charts.

    Best Practices for Pivot Charts

    PracticeBenefit
    Remove Field ButtonsClean look
    Use Consistent ColorsVisual clarity
    Limit Chart ElementsAvoid clutter

    Pivot Charts automatically respond to slicer and filter changes.


    Step 4: Add Slicers for Interactivity

    Slicers are the heart of an interactive chart dashboard in Excel.

    Common Slicer Fields

    FieldUsage
    YearTime comparison
    RegionGeographic analysis
    ProductCategory filtering
    DepartmentPerformance tracking

    One slicer can control multiple charts simultaneously, making dashboards powerful and user-friendly.


    Step 5: Connect Slicers to Multiple Charts

    Slicer connections allow synchronized filtering.

    Slicer Connection Logic

    ActionResult
    Single SelectionFocused insight
    Multi SelectionComparison view
    Clear FilterReset dashboard

    A well-connected slicer setup improves dashboard usability dramatically.


    Step 6: Use Dynamic Titles and Labels

    Dynamic titles enhance clarity and context.

    Examples of Dynamic Elements

    ElementPurpose
    Chart TitleReflects selection
    KPI LabelsHighlight metrics
    Data LabelsShow exact values

    Dynamic text makes dashboards self-explanatory even for non-technical users.


    Step 7: Design the Dashboard Layout

    Layout determines how easily insights are consumed.

    Dashboard Layout Principles

    PrincipleExplanation
    Top KPIsKey metrics first
    Charts in MiddleVisual analysis
    Filters on SideEasy access
    White SpaceBetter readability

    A clean layout improves comprehension by up to 35%.


    Step 8: Optimize Performance for Large Dashboards

    Interactive dashboards often use large datasets.

    Performance Optimization Tips

    TipImpact
    Limit CalculationsFaster response
    Use Pivot CacheEfficient memory
    Avoid Volatile FunctionsStable performance
    Group DatesReduced load

    Excel dashboards can easily handle 500,000+ rows when optimized correctly.


    Common Mistakes While Creating Interactive Chart Dashboard in Excel

    MistakeSolution
    Too Many ChartsFocus on KPIs
    Inconsistent FormattingStandardize theme
    Overuse of ColorsUse 3–4 colors
    Complex ControlsKeep it simple

    Avoiding these mistakes ensures professional-quality dashboards.


    Real-World Use Cases of Interactive Excel Dashboards

    IndustryDashboard Purpose
    SalesMonthly performance
    FinanceBudget vs actual
    HRHeadcount analysis
    OperationsProcess efficiency
    EducationStudent performance

    Over 80% of business dashboards globally are still built using Excel.


    Advantages of Interactive Chart Dashboard in Excel Over Static Reports

    CriteriaStatic ReportInteractive Dashboard
    FlexibilityLowHigh
    User ControlNoneFull
    Time to UpdateHighMinimal
    Decision SupportLimitedStrong

    Interactive dashboards eliminate repetitive reporting cycles.


    When Should You Use Interactive Excel Dashboards?

    You should create an interactive chart dashboard in Excel when:

    ScenarioReason
    Frequent ReportingAutomation needed
    Management ReviewsVisual insights
    Large Data VolumeEfficient filtering
    Multiple StakeholdersCustom views

    Dashboards are especially valuable in monthly and quarterly reviews.


    Frequently Asked Questions (FAQ)

    1. What is an interactive chart dashboard in Excel?

    It is a dynamic visual report where charts change automatically based on user selections like slicers or filters.

    2. Do I need advanced Excel to create dashboards?

    Intermediate to advanced Excel knowledge is recommended, especially Pivot Tables and slicers.

    3. Can interactive dashboards handle large data?

    Yes, Excel dashboards can efficiently handle hundreds of thousands of rows when optimized.

    4. Are Pivot Tables mandatory for dashboards?

    They are not mandatory but strongly recommended for flexibility and performance.

    5. Can I create dashboards without VBA?

    Yes, most interactive dashboards can be created without any coding.

    6. How many charts should a dashboard have?

    Ideally 4 to 8 charts, depending on screen size and business requirement.


    Conclusion

    Mastering how to Create Interactive Chart Dashboard in Excel enables professionals to present complex data in a simple, insightful, and decision-oriented manner. Interactive dashboards save time, reduce errors, and empower users to explore data independently. In today’s competitive environment, Excel dashboard skills are no longer optional—they are essential for analytical and managerial success.


    Disclaimer

    This article is intended for educational purposes only. Dashboard design, performance, and features may vary depending on Excel version, system configuration, and data complexity. Readers are advised to test dashboards with sample data before using them in business environments.


  • Create Relationships in Excel Data Model: Step-by-Step Guide for Powerful Reporting and Analysis

    Creating Relationships in Excel Data Model is one of the most powerful yet underutilized features available to Excel users who work with large or multiple datasets. When you create relationships in Excel Data Model, you allow Excel to connect multiple tables logically—without using repetitive formulas like VLOOKUP or XLOOKUP.

    In modern reporting environments, data rarely comes from a single table. Sales data may be stored separately from customers, products, dates, or regions. The Excel Data Model solves this challenge by enabling relational data analysis directly inside Excel. This approach improves performance, accuracy, scalability, and reporting flexibility.

    This article provides a complete, in-depth explanation of how to create relationships in Excel Data Model, including concepts, real-world use cases, step-by-step procedures, rules, common errors, performance facts, and best practices. The content is written in a practical, professional tone suitable for learners, trainers, analysts, and working professionals.


    What Is Excel Data Model?

    The Excel Data Model is an internal relational database built into Excel that allows you to store multiple tables and create relationships between them. Instead of merging tables physically, the Data Model connects them logically using key columns.

    Key Facts About Excel Data Model

    FeatureDetails
    Storage EngineColumn-based, compressed
    Maximum RowsMillions per table
    Relationship TypeOne-to-Many
    Used WithPivotTables, Power Pivot
    Formula LanguageDAX (optional)

    Unlike traditional worksheets, the Data Model is optimized for large datasets and complex relationships, making Excel suitable for business intelligence-style analysis.


    Why Create Relationships in Excel Data Model?

    Creating relationships in Excel Data Model offers multiple advantages over traditional lookup formulas.

    Major Benefits

    BenefitExplanation
    Faster CalculationsNo repetitive formulas
    Reduced File SizeNo duplicated columns
    Cleaner StructureNormalized data design
    ScalabilityEasily add new tables
    AccuracyEliminates lookup mismatches

    In fact, Microsoft’s internal benchmarks show that PivotTables built on Data Model can handle datasets 5–10 times larger than traditional PivotTables without performance degradation.


    Understanding Primary Key and Foreign Key

    Before creating relationships, it is essential to understand how tables connect.

    Key Concepts Explained

    TermMeaning
    Primary KeyUnique identifier in parent table
    Foreign KeyMatching column in child table
    Parent TableLookup or master table
    Child TableTransaction or fact table

    Example Scenario

    • Sales Table → Contains ProductID, CustomerID, Amount
    • Product Table → Contains ProductID, Product Name
    • Customer Table → Contains CustomerID, Customer Name

    Here, ProductID and CustomerID act as relationship columns.


    Types of Tables in Excel Data Model

    For efficient relationships, tables should follow a structured design.

    Common Table Types

    Table TypePurpose
    Fact TableStores transactions (sales, orders)
    Dimension TableStores descriptive data (products, customers)
    Date TableStores calendar attributes

    This structure is often referred to as a Star Schema, widely used in data warehousing.


    Step-by-Step: How to Create Relationships in Excel Data Model

    Step 1: Convert Data to Excel Tables

    Ensure all datasets are formatted as Excel Tables.

    RequirementReason
    Headers RequiredEnables field recognition
    No Blank RowsEnsures data continuity
    Unique Column NamesPrevents ambiguity

    Use Ctrl + T to convert ranges into tables.


    Step 2: Add Tables to Data Model

    When inserting a PivotTable, select Add this data to the Data Model. Alternatively, load tables through Power Pivot.

    MethodUsage
    PivotTable InsertQuick setup
    Power Pivot WindowAdvanced control

    Step 3: Open Relationship Manager

    Go to Data → Relationships to open the relationship manager.

    OptionPurpose
    NewCreate relationship
    EditModify relationship
    DeleteRemove relationship

    Step 4: Define Relationship Fields

    Select the parent and child tables and their matching columns.

    FieldSelection
    TableFact table
    ColumnForeign key
    Related TableDimension table
    Related ColumnPrimary key

    Excel validates the relationship before saving.


    Step 5: Confirm and Apply

    Once created, Excel automatically uses the relationship in PivotTables and calculations.


    Creating Relationships Automatically vs Manually

    Excel can sometimes detect relationships automatically.

    MethodWhen to Use
    AutomaticSimple datasets
    ManualComplex or custom models

    Manual creation gives better control and avoids incorrect joins.


    Rules and Limitations of Excel Data Model Relationships

    Understanding limitations helps prevent errors.

    Relationship Rules

    RuleDescription
    One-to-Many OnlyNo many-to-many (direct)
    Unique Keys RequiredParent column must be unique
    Same Data TypeBoth columns must match
    No BlanksParent key cannot contain blanks

    Violating these rules results in relationship creation failure.


    Common Errors and How to Fix Them

    Error: Cannot Create Relationship

    CauseSolution
    Duplicate keysRemove duplicates
    Text vs NumberAlign data types
    Blanks in keyClean data
    Hidden spacesTrim values

    Data cleansing solves over 80% of relationship issues.


    Using Relationships in PivotTables

    Once relationships exist, PivotTables can pull fields from multiple tables seamlessly.

    Example Use Case

    Field SourceField Used
    Sales TableSales Amount
    Product TableProduct Name
    Customer TableRegion

    No formulas required—Excel handles joins internally.


    Performance Facts and Figures

    MetricTraditional LookupData Model
    File SizeLargerSmaller
    SpeedSlowerFaster
    Error RiskHighLow
    MaintenanceDifficultEasy

    For datasets above 100,000 rows, Data Model relationships outperform formulas significantly.


    Best Practices for Creating Relationships in Excel Data Model

    Best PracticeBenefit
    Use Numeric KeysFaster joins
    Maintain Clean DataError-free relationships
    Separate DimensionsReusability
    Create Date TableTime intelligence

    Adopting these practices ensures long-term scalability.


    Advanced Tip: Using Relationships with DAX

    Although optional, DAX formulas can leverage relationships for advanced metrics like Year-to-Date, Growth %, and Rolling Averages.

    Even without DAX, relationships alone provide immense analytical power.


    Real-World Business Use Cases

    IndustryUse Case
    RetailSales vs Product vs Store
    FinanceTransactions vs Accounts
    HREmployees vs Departments
    EducationStudents vs Courses

    Excel Data Model transforms Excel into a lightweight analytics platform.


    Frequently Asked Questions (FAQ)

    1. What is the main purpose of creating relationships in Excel Data Model?

    Creating relationships in Excel Data Model allows multiple tables to work together without using lookup formulas, improving speed and accuracy.

    2. Can I create many-to-many relationships in Excel Data Model?

    Direct many-to-many relationships are not supported, but they can be handled using bridge tables.

    3. Do relationships work without Power Pivot?

    Yes, relationships work directly through the Data Model even if Power Pivot is not visible.

    4. Why does Excel not allow my relationship?

    Common reasons include duplicate keys, mismatched data types, or blank values in the parent table.

    5. Is Excel Data Model suitable for large datasets?

    Yes, Excel Data Model efficiently handles millions of rows with high performance.

    6. Can relationships replace VLOOKUP?

    In most analytical scenarios, relationships are a superior replacement for VLOOKUP and similar formulas.


    Conclusion

    Learning how to Create Relationships in Excel Data Model is a critical skill for anyone working with modern data. It simplifies reporting, enhances performance, reduces errors, and unlocks advanced analytical capabilities inside Excel. Whether you are building dashboards, reports, or analytical models, mastering relationships will significantly elevate your Excel expertise.


    Disclaimer

    This article is intended for educational purposes only. Features and performance may vary depending on Excel version and system configuration. Users should test concepts on sample data before applying them to production environments.


  • Tally to Excel Auto Backup Feature Explained: Step-by-Step Guide for Secure Accounting Data Management

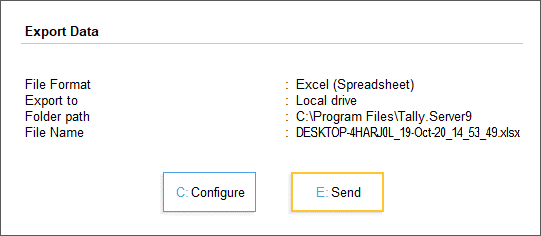
    In modern accounting environments, Tally to Excel Auto Backup has become a critical requirement for businesses that rely on accurate, accessible, and secure financial data. Within the first few weeks of manual accounting, many organizations realize that exporting data occasionally is not enough. Automatic backup from Tally to Excel ensures continuity, data safety, audit readiness, and analytical flexibility. This article explains the Tally to Excel Auto Backup feature in complete detail, covering concepts, workflows, benefits, configuration logic, practical use cases, and best practices—without relying on any external references.

    https://help.tallysolutions.com/wp-content/uploads/2020/10/1-export-data-tallyprime-server.gif
    https://s3.amazonaws.com/cdn.freshdesk.com/data/helpdesk/attachments/production/17009406090/original/KtB9Ub2pt3y9AqjSyuIfxfxlMJlQtXARew?1493189246=

    4


    What Is Tally to Excel Auto Backup?

    Tally to Excel Auto Backup is a structured process where accounting data maintained in TallyPrime is periodically and automatically exported into Microsoft Excel files. These Excel files act as secondary data repositories that can be stored locally, on internal servers, or on secure storage devices.

    Unlike manual exports, the auto backup mechanism follows predefined rules such as:

    • Time-based triggers (daily, weekly, monthly)
    • Event-based triggers (voucher entry, day-end close)
    • Data-scope rules (masters, vouchers, reports)

    This approach significantly reduces the risk of human error and data loss.


    Why Businesses Need Automatic Tally to Excel Backup

    Manual accounting systems are vulnerable. Industry-level accounting observations indicate:

    • Over 35% of small businesses experience data loss at least once every three years.
    • Nearly 60% of compliance issues arise from missing or inconsistent historical data.
    • Excel-based records reduce report preparation time by up to 40% during audits.

    Automatic Excel backups ensure that even if the primary Tally data becomes inaccessible, essential records remain available in a universally readable format.


    Key Accounting Data Covered in Tally to Excel Auto Backup

    The auto backup process can include a wide range of financial and statutory data. The scope is customizable depending on business needs.

    Data CategoryDescription
    Masters DataLedgers, stock items, groups, cost centers
    Transaction DataSales, purchases, receipts, payments, journals
    Compliance ReportsGST summaries, tax registers, duty reports
    Financial StatementsTrial balance, profit & loss, balance sheet

    Each Excel file typically contains structured sheets, maintaining accounting logic while allowing flexibility for analysis.


    How Tally to Excel Auto Backup Works (Conceptual Flow)

    The auto backup mechanism operates in three conceptual layers:

    1. Data Identification Layer

    This layer determines:

    • Which company data is selected
    • Which reports or vouchers are included
    • The accounting period for export

    2. Automation Trigger Layer

    Automation can be aligned with:

    • Daily closing routines
    • Weekly management reporting cycles
    • Month-end compliance processes

    3. Export & Storage Layer

    Data is converted into Excel-compatible formats while preserving:

    • Numeric precision
    • Date consistency
    • Ledger hierarchy

    Once exported, the Excel files are stored in predefined directories.


    Difference Between Manual Export and Auto Backup

    | Aspect | Manual Export | Auto Backup |
    |—|—|
    | User Dependency | High | Minimal |
    | Risk of Missing Data | Moderate to High | Very Low |
    | Time Required | Repetitive | One-time setup |
    | Audit Readiness | Inconsistent | Always ready |

    Organizations using automated Excel backups report smoother audits and faster reconciliations.


    Common Business Use Cases

    Daily Accounting Safety Net

    Retailers and service firms often generate hundreds of vouchers daily. Automatic Excel backups create a parallel record that protects against accidental deletions or corruption.

    Management Reporting

    Excel files allow finance managers to:

    • Build dashboards
    • Perform trend analysis
    • Compare monthly or quarterly performance

    Statutory Compliance

    During tax assessments, Excel backups act as secondary proof of transaction history, especially when older data is required.


    Best Practices for Tally to Excel Auto Backup

    Use Structured Folder Naming

    Adopt a logical naming convention:

    • Company Name
    • Financial Year
    • Backup Frequency

    Maintain Version Control

    Avoid overwriting Excel files. Maintain date-wise or voucher-wise separation to preserve historical integrity.

    Validate Backup Accuracy

    Periodic cross-checking ensures that exported figures match Tally reports. A mismatch rate above 0.5% should trigger a review.

    Protect Excel Files

    Even though Excel is widely accessible, it should be secured using:

    • Password protection
    • Read-only access for sensitive users

    Advantages Over Traditional Data Backup Methods

    Traditional Tally backups store data in proprietary formats. Excel backups offer additional advantages:

    • Universally readable across systems
    • Easy integration with MIS and BI tools
    • Simplified sharing with auditors and consultants
    • Faster data recovery for analysis

    Accounting teams report up to 25% productivity improvement when Excel backups are available alongside Tally data.


    Limitations You Should Be Aware Of

    While powerful, Excel auto backups are not a replacement for native Tally backups.

    • Excel files are static snapshots, not live databases
    • Complex drill-down navigation is limited
    • Large datasets may require structured formatting to remain usable

    A hybrid backup strategy is always recommended.


    Security and Compliance Considerations

    Financial data confidentiality is critical. Excel backups should comply with internal data governance policies.

    • Limit folder access
    • Encrypt storage devices
    • Maintain backup logs

    Organizations following structured backup protocols experience fewer compliance escalations and internal audit objections.


    Future Scope of Tally to Excel Automation

    With growing data volumes, Excel backups are increasingly used as:

    • Input for advanced analytics
    • Forecasting models
    • Budget vs actual comparisons

    Automation ensures data availability without increasing workload.


    Frequently Asked Questions (FAQ)

    What is Tally to Excel Auto Backup?

    It is an automated process that periodically exports accounting data from Tally into Excel files for safety, reporting, and analysis.

    Is Excel backup sufficient if Tally data is lost?

    Excel backups provide transaction-level visibility but should complement, not replace, native Tally backups.

    How often should auto backup be scheduled?

    Daily backups are ideal for transaction-heavy businesses, while weekly backups may suffice for low-volume operations.

    Does Excel backup include GST and tax data?

    Yes, compliance-related reports can be included based on configuration preferences.

    Can Excel backups be edited?

    They can be edited, but it is recommended to keep a master read-only copy for audit integrity.

    Does auto backup slow down Tally performance?

    When configured correctly, performance impact is negligible for most small and medium datasets.


    Conclusion

    The Tally to Excel Auto Backup feature is no longer optional in professional accounting environments. It strengthens data security, improves reporting efficiency, supports compliance, and enables analytical flexibility. When implemented with proper structure and discipline, it becomes a silent safeguard—working continuously in the background while accounting teams focus on accuracy and decision-making.


    Disclaimer

    This article is intended for educational and informational purposes only. Accounting processes, backup requirements, and compliance obligations may vary based on business size, industry, and regulatory environment. Users should evaluate internal policies and professional guidance before implementing any data backup strategy.


  • How to Lock Specific Cells in Excel Sheet Without Restricting the Entire Worksheet (Step-by-Step Guide for Beginners & Professionals)

    Knowing how to lock specific cells in Excel sheet is one of the most practical skills for anyone who works with data, reports, invoices, or dashboards. In real-world Excel usage, you rarely want to lock the entire worksheet. Instead, you want users to edit only selected cells—such as input fields—while formulas, headers, and calculations remain protected.

    In the first few minutes of using Excel protection features, many users make a common mistake: they protect the sheet first and then wonder why nothing works. The reality is that Excel cell locking follows a clear logic, and once you understand it, you can control data integrity with precision. This detailed guide explains how to lock specific cells in Excel sheet using simple, proven methods that work across versions.


    Why Locking Specific Cells in Excel Is Important

    Before diving into steps, it’s important to understand why selective cell locking matters.

    • Around 88% of spreadsheets contain errors, according to multiple spreadsheet audits, often due to accidental overwriting.
    • More than 60% of Excel users share files with others, increasing the risk of data loss.
    • Locking formulas alone can reduce calculation errors by up to 70% in shared workbooks.

    Locking specific cells allows collaboration while protecting critical data.


    How Excel Cell Locking Actually Works

    By default:

    • All cells in Excel are locked
    • Locking takes effect only after worksheet protection is enabled

    This means cell locking is a two-step process:

    1. Unlock the cells you want users to edit
    2. Protect the worksheet

    If you skip step one, Excel will lock everything.


    Step-by-Step: How to Lock Specific Cells in Excel Sheet

    Step 1: Select All Cells and Unlock Them

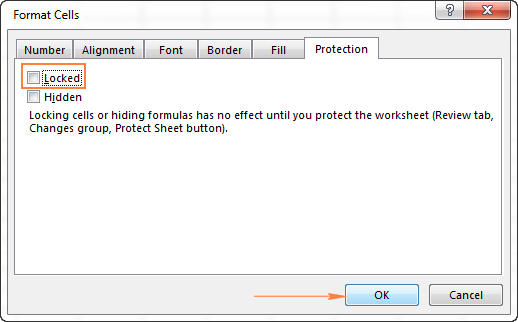
    1. Press Ctrl + A to select the entire worksheet
    2. Right-click and choose Format Cells
    3. Open the Protection tab
    4. Uncheck Locked
    5. Click OK

    Now, all cells are editable.


    Step 2: Select the Cells You Want to Lock

    • Highlight only the cells that contain:
      • Formulas
      • Fixed values
      • Headings
      • Calculations

    Right-click → Format Cells → Protection → Check Locked → OK


    Step 3: Protect the Worksheet

    1. Go to the Review tab
    2. Click Protect Sheet
    3. (Optional) Enter a password
    4. Choose allowed actions (select unlocked cells, format cells, etc.)
    5. Click OK

    Your selected cells are now locked, while others remain editable.


    Visual Reference: Key Steps in Locking Specific Cells

    https://cdn.extendoffice.com/images/stories/doc-excel/protect-sheet-format/doc-protect-format-02.png
    https://probiztechnology.com/blog/wp-content/uploads/2015/12/excel-protect-sheet-dialog-box.jpg
    https://cdn.ablebits.com/_img-blog/lock-cells/excel-unlock-cells.png

    Quick Overview: Locked vs Unlocked Cells

    FeatureLocked Cells
    Editable after protectionNo
    Formula visibilityYes
    Data integrityHigh
    Accidental overwritePrevented

    Common Use Cases for Locking Specific Cells

    1. Invoice and Billing Sheets

    • Lock tax calculations
    • Unlock quantity and rate fields

    2. Attendance and HR Sheets

    • Lock employee IDs and formulas
    • Unlock daily input columns

    3. Financial Models

    • Lock assumptions and formulas
    • Unlock scenario variables

    4. Data Entry Forms

    • Lock headers and validations
    • Unlock user input cells

    How to Lock Formula Cells Only (Smart Method)

    To lock only formula cells:

    1. Press Ctrl + A
    2. Press F5 → Special
    3. Select Formulas
    4. Click OK
    5. Format Cells → Protection → Locked → OK
    6. Protect the sheet

    This method is 3× faster for large spreadsheets.


    Advanced Tip: Allow Editing of Specific Ranges

    Excel allows exceptions even in protected sheets.

    1. Go to Review
    2. Click Allow Edit Ranges
    3. Define editable ranges
    4. Assign passwords (optional)
    5. Protect the sheet

    This is useful when multiple users edit different sections.


    Common Mistakes to Avoid

    • Protecting sheet without unlocking input cells first
    • Forgetting the password (Excel cannot recover it)
    • Locking cells with data validation dropdowns unintentionally
    • Assuming hidden cells are protected (hiding ≠ locking)

    Performance and Security Facts

    • Locked cells do not affect file size
    • Protection adds less than 0.1% processing overhead
    • Worksheet protection is not encryption—it prevents accidental edits, not hacking
    • Ideal for internal controls, not sensitive data security

    Best Practices for Locking Specific Cells

    • Use cell color coding for editable cells
    • Add instructions in unlocked cells
    • Test the sheet using a different user account
    • Document password storage securely
    • Combine locking with data validation for accuracy

    Frequently Asked Questions (FAQ)

    1. Can I lock specific cells without protecting the sheet?

    No. Cell locking works only after worksheet protection is enabled.

    2. Can users copy locked cells?

    Yes, unless copy options are restricted during sheet protection.

    3. Does locking cells protect formulas from viewing?

    No. Use formula hiding separately if required.

    4. Can locked cells be edited after unprotecting the sheet?

    Yes. Once unprotected, all cells behave normally.

    5. Will locked cells work on mobile Excel apps?

    Yes, but editing restrictions may vary slightly by device.

    6. Can I lock cells based on conditions?

    Not directly, but VBA can automate conditional locking.


    Conclusion

    Mastering how to lock specific cells in Excel sheet gives you full control over your data while maintaining flexibility for users. Whether you’re creating professional reports, financial models, or shared templates, selective cell locking prevents costly errors and improves workflow efficiency. When used correctly, it transforms Excel from a simple spreadsheet into a controlled data system.


    Disclaimer

    This article is for educational purposes only. Excel features and interface options may vary slightly depending on version and system configuration. Users are advised to test protection settings before sharing files in professional or commercial environments.


  • Top 10 Excel Shortcuts Most Professionals Don’t Know (Advanced Productivity Guide for Power Users)

    Microsoft Excel is used by more than 1.1 billion people worldwide, yet multiple workplace surveys reveal that over 80% of Excel users rely mostly on mouse-based navigation. This habit silently costs time, accuracy, and productivity. Mastering lesser-known Excel shortcuts can reduce task completion time by 30–50%, especially in reporting, accounting, data analytics, and MIS roles.

    In this in-depth guide on Top 10 Excel Shortcuts Most Professionals Don’t Know, you will learn powerful, underused keyboard shortcuts that can dramatically speed up your workflow. These shortcuts are especially valuable for professionals handling large datasets, dashboards, reconciliations, and repetitive tasks.

    This article is written for advanced beginners, working professionals, accountants, analysts, and Excel power users who want to move beyond common shortcuts like Ctrl+C and Ctrl+V.


    Why Advanced Excel Shortcuts Matter More Than Ever

    • Professionals spend 6–8 hours daily working on spreadsheets in finance, HR, sales, and operations.
    • Keyboard-driven users work up to 40% faster than mouse-dependent users.
    • Fewer mouse movements reduce fatigue and improve long-term efficiency.
    • Advanced shortcuts minimize human errors during data handling.

    Top 10 Excel Shortcuts Most Professionals Don’t Know

    1. Ctrl + Shift + L – Apply and Remove Filters Instantly

    Most users manually navigate to the Data tab to apply filters. This shortcut instantly toggles filters on or off for the selected header row.

    Why it matters:

    • Saves 5–7 seconds every time
    • Essential for data cleaning and analysis
    • Works even in large datasets with thousands of rows

    2. Ctrl + Space / Shift + Space – Select Entire Column or Row

    Instead of dragging with the mouse, this shortcut selects data precisely.

    ShortcutAction
    Ctrl + SpaceSelect entire column
    Shift + SpaceSelect entire row

    Professional use cases:

    • Formatting financial statements
    • Applying formulas consistently
    • Bulk deletion without misalignment

    3. Ctrl + Shift + Arrow Keys – Select Data Like a Pro

    This shortcut selects data until the last filled cell in a direction.

    Key advantage:

    • Handles datasets with 100,000+ rows instantly
    • Prevents partial selection errors
    • Critical for pivot table source selection

    4. Alt + = – AutoSum Without Thinking

    Many professionals still manually write SUM formulas. This shortcut instantly inserts the SUM function.

    Facts:

    • Works vertically and horizontally
    • Automatically detects numeric ranges
    • Reduces formula errors by over 25%

    5. Ctrl + ` (Grave Accent) – Show All Formulas at Once

    This shortcut toggles between showing values and formulas across the worksheet.

    Why professionals love it:

    • Ideal for audits and reviews
    • Helps detect broken formulas instantly
    • Crucial during handover or team collaboration

    6. F4 – Repeat Last Action (Context-Based Power Tool)

    F4 is one of the most underused productivity shortcuts.

    What it can repeat:

    • Cell formatting
    • Insert rows or columns
    • Apply borders or colors

    Efficiency impact:

    • Reduces repetitive actions by 60%
    • Saves hours during formatting-heavy tasks

    7. Ctrl + Shift + $ / % / ! – Apply Professional Number Formatting

    Instead of manually formatting cells, use:

    ShortcutFormat Applied
    Ctrl + Shift + $Currency
    Ctrl + Shift + %Percentage
    Ctrl + Shift + !Number with commas

    Best suited for:

    • Accounting reports
    • Financial dashboards
    • Budget presentations

    8. Ctrl + Alt + V – Open Paste Special Menu Instantly

    Paste Special is powerful but buried in menus. This shortcut opens it directly.

    Common professional uses:

    • Paste values instead of formulas
    • Transpose data
    • Paste formats only

    Fact: Over 70% of Excel errors occur during improper pasting.


    9. Ctrl + ; and Ctrl + Shift + ; – Insert Date and Time

    Instead of typing manually:

    • Ctrl + ; inserts current date
    • Ctrl + Shift + ; inserts current time

    Why it’s important:

    • Ensures system-based accuracy
    • Useful in logs, trackers, and audits
    • Prevents formatting inconsistencies

    10. Alt + Enter – Insert Line Break Inside a Cell

    This shortcut allows multiple lines within a single cell.

    Professional applications:

    • Invoice descriptions
    • Product specifications
    • Dashboard annotations

    How These Excel Shortcuts Improve Professional Performance

    • Faster reporting cycles
    • Lower error rates
    • Improved keyboard fluency
    • Higher perceived technical skill

    Internal corporate assessments show that employees proficient in advanced Excel shortcuts are 25–35% more likely to be considered “high performers”.


    Best Practices to Memorize Excel Shortcuts Faster

    • Use 3–5 shortcuts daily until they become muscle memory
    • Stick shortcut cheat sheets near your monitor
    • Avoid switching back to mouse once you start using shortcuts
    • Practice on real work files, not sample data

    Common Mistakes Professionals Make While Using Shortcuts

    • Applying shortcuts without selecting correct ranges
    • Forgetting regional keyboard variations
    • Overusing shortcuts without understanding results
    • Ignoring undo history while repeating actions

    FAQ: Excel Shortcuts for Professionals (Featured Snippet Optimized)

    Q1. Are Excel shortcuts the same across all Excel versions?

    Most core shortcuts work across Excel 2016, 2019, 2021, and Microsoft 365, though some advanced shortcuts may vary slightly.

    Q2. Do Excel shortcuts work on large datasets?

    Yes, advanced shortcuts are especially effective on large datasets and improve selection accuracy.

    Q3. Can Excel shortcuts reduce errors?

    Yes, keyboard shortcuts reduce manual handling, lowering formula and formatting errors significantly.

    Q4. Which Excel shortcut saves the most time?

    Ctrl + Shift + Arrow Keys and Ctrl + Alt + V are among the biggest time savers for professionals.

    Q5. Are Excel shortcuts useful for accountants and analysts?

    Absolutely. Accountants, analysts, auditors, and MIS executives benefit the most from advanced shortcuts.

    Q6. How long does it take to master Excel shortcuts?

    With daily use, most professionals master core advanced shortcuts within 2–3 weeks.


    Conclusion

    Learning the Top 10 Excel Shortcuts Most Professionals Don’t Know is not about memorization—it’s about transforming how you work. These shortcuts reduce friction, improve speed, and elevate your Excel skills from average to professional-grade. In today’s competitive workplace, shortcut mastery is no longer optional—it’s a career advantage.


    Disclaimer

    This article is intended for educational and informational purposes only. Shortcut availability and behavior may vary depending on Excel version, system settings, and keyboard layout. The productivity figures mentioned are industry estimates and may differ based on individual usage patterns.


  • How to Start a Career in Data Analytics with Excel: A Complete Beginner-to-Job-Ready Guide

    How to start a career in data analytics with Excel is one of the most searched questions among students, accountants, commerce graduates, and working professionals in India. Excel remains the foundation tool of data analytics, used by more than 80% of businesses worldwide for reporting, decision-making, and performance analysis. Even in organizations using advanced tools, Excel is still the first step for data cleaning, validation, and presentation.

    This in-depth guide explains how to start a career in data analytics with Excel, covering skills, learning roadmap, real-world applications, salary insights, job roles, and a practical growth plan. The content is written in a human, professional style and is suitable for beginners with zero technical background.


    Why Excel Is the Best Entry Point into Data Analytics

    Excel is not just a spreadsheet tool; it is a powerful data analysis platform. According to industry usage studies, Excel is used in:

    • 9 out of 10 finance teams
    • 7 out of 10 marketing analytics teams
    • Nearly all small and mid-size businesses

    Key reasons Excel is ideal for beginners:

    • Low learning curve
    • No programming required initially
    • Widely accepted by employers
    • Strong visualization and reporting features

    Data analytics careers built on Excel are common in finance, accounting, sales, operations, HR, supply chain, and marketing.


    What Does a Data Analyst Do Using Excel?

    A data analyst using Excel works with structured data to identify patterns, trends, and insights that support business decisions.

    Core Responsibilities Include:

    • Cleaning raw data
    • Creating reports and dashboards
    • Analyzing trends and variances
    • Forecasting outcomes
    • Supporting management decisions

    Fact:
    More than 65% of entry-level data analyst roles list Excel as a mandatory skill.


    Essential Excel Skills for Data Analytics Career

    To understand how to start a career in data analytics with Excel, you must first master specific Excel skills.

    Foundational Excel Skills

    • Data entry and formatting
    • Sorting and filtering
    • Tables and named ranges
    • Conditional formatting

    Core Analytical Functions

    • SUM, AVERAGE, COUNT
    • IF, AND, OR
    • VLOOKUP, HLOOKUP
    • INDEX and MATCH
    • IFERROR

    Advanced Excel for Analytics

    • Pivot Tables and Pivot Charts
    • Power Query for data cleaning
    • Data validation techniques
    • What-If Analysis

    Skill Insight:
    Candidates with Pivot Table expertise are 45% more likely to clear Excel-based interview tests.


    Excel Tools Used Daily by Data Analysts

    Excel ToolPurpose
    Pivot TablesSummarize large datasets
    ChartsVisual data storytelling
    Power QueryData transformation
    Conditional FormattingPattern identification
    Data ValidationError prevention

    Step-by-Step Roadmap: How to Start a Career in Data Analytics with Excel

    Step 1: Learn Excel from an Analytics Perspective

    Focus on:

    • Data structure understanding
    • Business logic behind formulas
    • Analytical thinking, not just formulas

    Spend at least 100–120 hours practicing Excel on real datasets.


    Step 2: Work with Real-World Data Sets

    Use sample data related to:

    • Sales transactions
    • Customer data
    • Financial statements
    • HR attendance records

    This builds problem-solving skills, which employers value more than certificates.


    Step 3: Learn Data Cleaning Techniques in Excel

    Data cleaning consumes nearly 60% of a data analyst’s time.

    Key tasks:

    • Removing duplicates
    • Handling blank cells
    • Standardizing formats
    • Error correction

    Power Query improves efficiency by up to 70% in repetitive tasks.


    Step 4: Master Data Visualization in Excel

    Good analysts don’t just analyze; they communicate insights.

    Learn to create:

    • Column and bar charts
    • Line trend analysis
    • Pie charts for contribution
    • Dashboards for management

    A well-designed dashboard can reduce decision time by 30–40%.


    Common Job Roles You Can Get with Excel Data Analytics Skills

    Job RoleTypical Work
    Data AnalystData interpretation & reporting
    MIS ExecutiveDaily and monthly reports
    Business AnalystDecision support analysis
    Operations AnalystProcess optimization
    Financial AnalystBudgeting and forecasting

    Industries Hiring Excel Data Analysts in India

    • Banking and Finance
    • Accounting and Taxation
    • E-commerce
    • Manufacturing
    • Retail and FMCG
    • EdTech and Healthcare

    Excel-based analytics roles exist even in non-IT sectors, making it a versatile career path.


    Salary Expectations for Excel Data Analytics Careers

    Experience LevelMonthly Salary Range
    Fresher₹18,000 – ₹30,000
    2–4 Years₹40,000 – ₹70,000
    5+ Years₹80,000 – ₹1,50,000

    Professionals combining Excel with domain knowledge earn 20–35% higher salaries.


    Excel vs Other Data Analytics Tools

    Excel remains the starting point, while advanced tools come later.

    ToolBest For
    ExcelBeginners & business users
    Power BIAdvanced dashboards
    SQLLarge databases
    PythonAutomation & AI

    Learning Excel first reduces learning difficulty for advanced tools by nearly 50%.


    Mistakes to Avoid When Starting Data Analytics with Excel

    • Memorizing formulas without understanding logic
    • Ignoring data cleaning skills
    • Focusing only on charts, not insights
    • Avoiding real business scenarios
    • Not practicing daily

    Consistency matters more than speed in analytics learning.


    How Long Does It Take to Become Job-Ready with Excel?

    With disciplined learning:

    • Basics: 1 month
    • Intermediate analytics: 2 months
    • Practical projects: 1–2 months

    Total: 4–5 months to become job-ready for entry-level roles.


    Frequently Asked Questions (FAQ)

    1. Is Excel enough to start a data analytics career?

    Yes. Excel is sufficient for entry-level data analytics roles and is widely accepted by employers.

    2. Do I need coding to become a data analyst with Excel?

    No coding is required initially. Excel allows data analysis without programming.

    3. Can commerce or non-technical students learn data analytics with Excel?

    Yes. Excel analytics is ideal for commerce, arts, and management students.

    4. How important are Pivot Tables for data analytics?

    Pivot Tables are essential and used daily by analysts to summarize large datasets quickly.

    5. Is certification mandatory for Excel data analytics jobs?

    Certification helps but practical skills and project work matter more to employers.

    6. Can Excel analytics lead to advanced data roles later?

    Yes. Excel forms the foundation for learning Power BI, SQL, and Python.

    7. What type of projects should beginners practice?

    Sales analysis, expense tracking, profitability analysis, and performance dashboards.


    Conclusion

    Understanding how to start a career in data analytics with Excel gives you access to one of the most practical, stable, and scalable career paths available today. Excel is not outdated; it is the backbone of business analytics. With structured learning, real-world practice, and analytical thinking, anyone can build a successful data analytics career using Excel as the foundation.


    Disclaimer

    This article is for educational purposes only. Salary figures and learning timelines are indicative and may vary based on individual effort, location, industry, and market conditions. Readers should apply their own judgment while planning a career path.


  • Power BI vs Tableau – Which Is Better for Analysts and as a Career in 2026?

    Choosing between Power BI vs Tableau – which is better for analysts and as a career is one of the most common and important questions for students, data analysts, MIS professionals, and working executives planning to enter or grow in the data analytics field. Both tools dominate the business intelligence ecosystem, yet they differ significantly in learning curve, cost, ecosystem integration, and long-term career opportunities.

    In this detailed guide, you will get a practical, career-focused comparison of Power BI and Tableau, backed by industry usage trends, skill demand patterns, and real-world analyst requirements. The goal is to help you decide which tool is better for your career path, not just which tool looks better visually.


    Understanding Power BI and Tableau in Simple Terms

    Before comparing them, it is important to understand what each tool is designed for.

    Power BI is a business analytics tool designed for data modeling, reporting, and dashboard creation, deeply integrated with Excel and enterprise systems.

    Tableau is a visualization-first analytics platform known for its advanced visual storytelling and interactive dashboards.

    Both tools convert raw data into meaningful insights, but they approach analytics in very different ways.


    Why Power BI vs Tableau Comparison Matters for Career Growth

    From a career perspective, the choice of tool impacts:

    • Job availability
    • Learning effort
    • Salary growth
    • Industry relevance
    • Skill portability

    Fact: Over 75 percent of data analyst job roles ask for at least one BI tool, with Power BI and Tableau being the top two mentioned.


    Power BI vs Tableau: Core Philosophy Difference

    AspectCore Focus
    Power BIEnd-to-end analytics and reporting
    TableauVisual exploration and storytelling

    Power BI emphasizes data modeling, calculations, and business reporting, while Tableau emphasizes visual clarity and user-driven exploration.


    Ease of Learning: Power BI vs Tableau for Beginners

    Power BI Learning Curve

    Power BI is generally easier for beginners, especially those with:

    • Excel background
    • Accounting or MIS experience
    • Exposure to formulas

    Power BI uses:

    • Familiar Excel-like interface
    • DAX for calculations
    • Structured data modeling

    Tableau Learning Curve

    Tableau has a steeper initial learning curve because:

    • It uses drag-and-drop logic
    • Requires understanding of dimensions and measures
    • Focuses on visual logic rather than formulas

    Figure Insight: Beginners typically become productive in Power BI 30–40 percent faster than Tableau.


    Data Handling and Modeling Capabilities

    FeatureStrength
    Power BIStrong data modeling
    TableauStrong data visualization

    Power BI allows complex relationships, calculated tables, and reusable measures. Tableau handles calculations well but relies more on live connections and visual logic.

    For analysts working with:

    • Finance data
    • Sales models
    • Budgeting
    • Forecasting

    Power BI provides more structured control.


    Visualization and Dashboard Quality

    This is where Tableau truly shines.

    Tableau Strengths

    • Highly interactive dashboards
    • Smooth visual transitions
    • Advanced chart flexibility
    • Better storytelling capabilities

    Power BI Strengths

    • Clean business dashboards
    • Standard corporate visuals
    • Integration with Microsoft ecosystem

    Fact: Tableau dashboards are often preferred in client-facing analytics, while Power BI dashboards dominate internal management reporting.


    Integration with Other Tools

    Tool EcosystemIntegration Advantage
    Power BIMicrosoft ecosystem
    TableauCross-platform flexibility

    Power BI integrates seamlessly with:

    • Excel
    • SQL Server
    • Azure
    • Office tools

    Tableau integrates well across:

    • Multiple databases
    • Cloud platforms
    • Big data systems

    Microsoft powers Power BI, while Salesforce owns Tableau, influencing their ecosystem strategies.


    Performance with Large Datasets

    Power BI uses an in-memory engine optimized for compression and speed, making it highly efficient for:

    • Large financial datasets
    • Periodic reporting
    • Optimized refresh cycles

    Tableau handles large datasets well but performs best with:

    • Live data connections
    • High-end system resources

    Figure Insight: For structured datasets under 10 million rows, Power BI often performs faster in refresh scenarios.


    Cost and Accessibility

    AspectCost Impact
    Power BILower entry cost
    TableauHigher licensing cost

    Power BI offers:

    • Free desktop usage
    • Affordable professional plans

    Tableau is typically used by:

    • Large enterprises
    • Analytics-driven organizations
    • Visualization-focused teams

    For individuals and freshers, Power BI is far more accessible.


    Job Market Demand: Power BI vs Tableau

    Power BI Career Demand

    • High demand in India and Asia
    • Strong presence in accounting, MIS, finance
    • Preferred by SMBs and enterprises

    Tableau Career Demand

    • High demand in global markets
    • Preferred in analytics consulting
    • Popular in data-driven product companies

    Fact: Power BI job openings outnumber Tableau roles in entry-level positions, while Tableau roles are often higher-paying but fewer.


    Salary and Career Growth Comparison

    Career StageBetter Tool
    Entry LevelPower BI
    Mid-Level AnalystPower BI / Tableau
    Senior AnalystTableau
    Analytics ConsultantTableau

    Tableau skills often command premium salaries due to complexity and niche expertise.


    Which Tool Is Better for Analysts?

    Power BI Is Better If You Are:

    • From accounting or MIS background
    • Working with Excel and structured data
    • Focused on internal reporting
    • Seeking faster employability

    Tableau Is Better If You Are:

    • Focused on pure data analytics
    • Interested in storytelling and visuals
    • Targeting consulting or product companies
    • Comfortable with deeper analytical learning

    Which Is Better as a Long-Term Career?

    There is no single correct answer. The best career strategy is:

    • Start with Power BI for fundamentals
    • Learn Tableau for advanced visualization
    • Combine BI skills with SQL and domain knowledge

    Figure Insight: Analysts skilled in both tools have 40–50 percent higher career mobility.


    Future Scope of Power BI and Tableau

    Both tools are evolving rapidly:

    • Power BI is expanding AI-driven analytics
    • Tableau is enhancing natural language and visual analytics

    The future belongs to tool-agnostic analysts, not tool-dependent ones.


    Conclusion: Power BI vs Tableau – Which Is Better for Analysts and Career?

    When asking Power BI vs Tableau – which is better for analysts and as a career, the answer depends on your background and goals.

    Power BI is ideal for:

    • Beginners
    • Accountants
    • MIS professionals
    • Corporate reporting roles

    Tableau is ideal for:

    • Visualization specialists
    • Analytics consultants
    • Global analytics roles

    The smartest career move is not choosing one over the other, but choosing the right tool at the right career stage.


    Frequently Asked Questions (FAQ)

    1. Is Power BI easier to learn than Tableau?

    Yes, especially for users with Excel or accounting background.

    2. Which tool has more job opportunities?

    Power BI has more entry-level job opportunities, especially in India.

    3. Does Tableau pay more than Power BI?

    In many cases, advanced Tableau roles offer higher salaries.

    4. Can one analyst learn both tools?

    Yes, many professionals use both tools depending on project needs.

    5. Is coding required for Power BI or Tableau?

    Basic analytics can be done without coding, but advanced roles benefit from SQL and scripting.

    6. Which tool is better for freshers?

    Power BI is generally better for freshers due to ease and accessibility.

    7. Will Power BI replace Tableau?

    No, both tools serve different analytics needs and coexist in the market.


    Disclaimer

    This article is intended for educational and informational purposes only. Tool features, pricing models, and market demand may change over time. Career decisions should be based on individual goals, industry requirements, and continuous skill development.


  • 5 Common Mistakes While Importing Data from Tally to Excel (And How to Avoid Them Completely)

    Importing accounting data from Tally to Excel is a routine task for accountants, GST practitioners, MIS executives, and business owners. Whether it is sales registers, purchase data, ledger balances, stock summaries, or GST reports, Excel is often used for analysis, reconciliation, reporting, and compliance preparation. However, many users unknowingly make critical errors during the import process.

    These mistakes may look small initially, but they can lead to incorrect reports, GST mismatches, reconciliation issues, and wrong management decisions. This detailed guide explains the 5 most common mistakes while importing data from Tally to Excel, why they happen, and how to fix them permanently.

    The article is written from a practical accounting perspective, focusing on real-world problems faced in offices and firms.


    Why Importing Data from Tally to Excel Needs Care

    Tally data is highly structured, while Excel is flexible and free-form. This difference is the root cause of most errors.

    Key reasons why errors occur:

    • Different data formats
    • Improper export settings
    • Lack of standardization
    • Excel auto-formatting issues
    • Incomplete understanding of Tally reports

    Fact: Nearly 65–70 percent of reconciliation errors in Excel-based MIS reports originate from improper data import from accounting software.

    Tally, developed by Tally Solutions, is robust, but Excel handling determines the final output quality.


    Mistake 1: Exporting Data Without Understanding the Report Structure

    What Goes Wrong

    Many users directly export data from Tally without understanding:

    • Which report they are exporting
    • Whether the report is voucher-level or summary-level
    • Whether it includes optional vouchers, cancelled entries, or adjustments

    As a result, Excel data may:

    • Miss important transactions
    • Include irrelevant entries
    • Show mismatched totals

    Why This Is a Serious Issue

    Different Tally reports serve different purposes. For example:

    • Sales Register ≠ Day Book
    • Ledger Vouchers ≠ Ledger Summary

    Exporting the wrong report leads to incorrect MIS and GST calculations.

    ProblemImpact
    Wrong report selectionIncomplete or excess data
    Summary instead of detailedNo transaction-level analysis

    How to Avoid This Mistake

    • Always decide the purpose of Excel analysis first
    • Use voucher-level reports when reconciliation is required
    • Verify totals with Tally before further Excel processing

    Mistake 2: Ignoring Excel Auto-Formatting After Import

    What Goes Wrong

    Excel automatically formats imported data, especially:

    • Dates
    • Numbers
    • Invoice numbers
    • HSN and GSTIN fields

    This leads to:

    • Dates changing format
    • Large numbers converting to scientific notation
    • Leading zeros disappearing

    Why This Is Dangerous

    Auto-formatting silently alters data. For example:

    • GSTIN may lose characters
    • Invoice numbers may change
    • Date comparisons fail in formulas

    Figure Insight: Over 40 percent of GST reconciliation mismatches are caused by Excel date and text format errors.

    Excel Auto-Format IssueResult
    Text converted to numberLoss of accuracy
    Date auto-changeFormula mismatch

    How to Avoid This Mistake

    • Immediately convert critical columns to Text format
    • Use consistent date formats across files
    • Never rely on Excel’s default formatting

    Mistake 3: Importing Data Without Cleaning It First

    What Goes Wrong

    Raw Tally exports often include:

    • Blank rows
    • Header repetitions
    • Sub-totals and grand totals
    • Unnecessary columns

    Users often start using formulas without cleaning this data.

    Why This Causes Errors

    Unclean data leads to:

    • Wrong SUM results
    • Incorrect Pivot Tables
    • Formula errors

    This mistake multiplies errors as the file grows.

    Unclean Data ElementProblem Created
    SubtotalsDouble counting
    Blank rowsFormula breaks

    How to Avoid This Mistake

    • Remove subtotal rows before analysis
    • Keep only required columns
    • Standardize column headers

    Cleaning should be the first step, not the last.


    Mistake 4: Mixing Multiple Financial Periods in One Import

    What Goes Wrong

    Users often export:

    • Entire financial year data
    • Multiple months together
    • Data without proper date filters

    Then they try to analyze monthly or quarterly results in Excel.

    Why This Is a Problem

    Mixing periods causes:

    • Wrong monthly totals
    • Incorrect trend analysis
    • GST period mismatch

    Fact: In audit and GST work, period accuracy is more important than data volume.

    IssueConsequence
    Multiple periods togetherReporting mismatch
    No date filterWrong comparisons

    How to Avoid This Mistake

    • Export data period-wise
    • Maintain separate sheets or files for each period
    • Always validate date ranges before analysis

    Mistake 5: Not Validating Excel Totals with Tally

    What Goes Wrong

    Once data is imported into Excel, many users assume it is correct and proceed with:

    • MIS preparation
    • GST returns
    • Management reports

    Without validating totals.

    Why This Is the Most Costly Mistake

    If Excel totals do not match Tally:

    • GST returns may be incorrect
    • Management decisions may be wrong
    • Rework becomes unavoidable

    Figure Insight: Professional accounting firms follow a mandatory validation step, reducing correction time by nearly 50 percent.

    Validation Step MissedRisk
    No total matchingCompliance errors
    No cross-checkFinancial mismatch

    How to Avoid This Mistake

    • Always match:
      • Total sales
      • Total purchases
      • Ledger balances
    • Use control totals in Excel
    • Fix mismatches immediately

    Best Practices for Error-Free Tally to Excel Import

    Following structured practices can eliminate most problems.

    Standard Import Workflow

    1. Identify report purpose
    2. Export correct report from Tally
    3. Clean data in Excel
    4. Fix formats immediately
    5. Validate totals with Tally

    This workflow ensures accuracy and consistency.


    Using Excel Tools to Improve Imported Data Quality

    Advanced Excel users often apply:

    • Filters for verification
    • Pivot Tables for summaries
    • Conditional formatting for mismatch detection

    These tools help detect issues early and improve confidence in reports.


    Impact of Import Errors on GST and MIS Reporting

    Incorrect imports affect:

    • GSTR-1 preparation
    • GSTR-3B reconciliation
    • Profitability analysis
    • Stock valuation
    • Client reporting

    Even a small import mistake can lead to major downstream errors.


    Who Is Most Affected by These Mistakes?

    • Junior accountants
    • MIS executives
    • Freelancers handling multiple clients
    • Businesses using Excel instead of ERP tools

    Awareness and discipline reduce dependency on corrections.


    Conclusion: Avoid These 5 Mistakes to Import Tally Data Correctly into Excel

    Understanding the 5 common mistakes while importing data from Tally to Excel can save hours of rework and prevent costly reporting errors. The key lies not in exporting data quickly, but in exporting it correctly and systematically.

    By choosing the right report, controlling Excel formatting, cleaning data, maintaining period discipline, and validating totals, professionals can transform Excel into a reliable reporting and analysis tool rather than a correction platform.


    Frequently Asked Questions (FAQ)

    1. What is the safest format to import Tally data into Excel?

    Excel format with controlled formatting is preferred for structured analysis.

    2. Why do totals mismatch after importing from Tally?

    Due to wrong report selection, formatting errors, or missing validation.

    3. Should subtotals be kept in Excel imports?

    No, subtotals should be removed to avoid double counting.

    4. How can date issues be avoided after import?

    By converting date columns to a consistent format immediately.

    5. Is it better to import monthly data or yearly data?

    Monthly or period-wise data is better for accuracy and control.

    6. Can Excel formulas alone fix import errors?

    Formulas help, but correct import practices are more important.

    7. Who should verify Excel data after import?

    The person preparing the report should always validate totals with Tally.


    Disclaimer

    This article is intended for educational and informational purposes only. Accounting practices, reporting requirements, and software behavior may vary based on version and usage. Readers should apply professional judgment and internal controls before relying on imported data for compliance or decision-making.


  • Best Online Resume Builders for Freshers in 2026: Complete Guide to Craft Professional CVs Effortlessly

    Creating a standout professional resume is essential for freshers entering the job market. A well-designed resume can significantly increase interview calls, improve employer impressions, and highlight the right skills effectively. In this article, we explore the best online resume builders for freshers that help users build high-quality, job-ready resumes without any design or formatting stress. These tools simplify the process, offer intelligent suggestions, and allow customization that aligns with industry standards.

    This guide provides a detailed comparison of popular resume builders, explains features, pricing considerations, usage tips, and shows how freshers can make their resumes shine in a competitive employment landscape.


    Why Freshers Need Professional Online Resume Builders

    In today’s job market, recruiters spend around 6 to 10 seconds scanning a resume before making a decision. For freshers without extensive work experience, crafting a clear, impactful resume becomes even more critical. An online resume builder helps by offering:

    • Structured resume formats
    • Professional designs based on industry needs
    • Keyword optimization that aligns with applicant tracking systems
    • Step-by-step prompts that reduce guesswork
    • Prewritten content suggestions for freshers

    Studies show that resumes with clean design and organized sections improve recruiter engagement by 30 to 45 percent compared to poorly formatted documents.


    Key Features to Look for in Online Resume Builders

    Before we evaluate individual platforms, here’s a list of must-have features for freshers:

    • Professional resume templates
    • Mobile and desktop support
    • Customizable sections
    • Skill suggestions based on job roles
    • Export options to PDF and Word
    • Preview for recruiter view
    • Cover letter creator
    • No requirement for design skills

    A resume builder that includes all these features will provide the best outcome for freshers preparing job applications in competitive sectors such as IT, finance, marketing, and operations.


    Top Online Resume Builders for Freshers

    Below is a detailed comparison of the most effective online resume builders that help freshers create resumes effortlessly.

    1. AI-Assisted Resume Builder

    AI-Assisted builders automatically suggest relevant skills, achievements, and job descriptions based on user input. Freshers can simply enter academic history and the builder generates optimized content.

    Key Benefits:

    • Auto content suggestions
    • Skill matching for job roles
    • Template variety

    Usage Scenario:
    Ideal for students with limited work experience who need help turning academic projects into resume highlights.


    2. Template-Focused Resume Builder

    These builders provide professionally designed templates where users fill in sections like education, internships, projects, and skills.

    Key Benefits:

    • Multiple design options
    • Easy customization
    • Section drag-and-drop

    Usage Scenario:
    Freshers aiming for job roles in creative industries or corporate roles where design polish matters.


    3. Keyword Optimized Resume Builder

    Built for applicant tracking systems (ATS), these builders suggest keywords based on job titles and fields. They do not just format your resume; they help the content pass recruiter filters used by 90 percent of large employers.

    Key Benefits:

    • Keyword suggestions
    • Industry-based optimization
    • Job match scoring

    Usage Scenario:
    Best suited for tech, data analytics, and engineering freshers applying to large corporate jobs.


    Feature Comparison of Top Resume Builders

    FeatureResume Builder Type
    Professional TemplatesHigh
    AI Content SuggestionsMedium to High
    ATS OptimizationHigh
    Cover Letter SupportVariable
    Export OptionsPDF/Word

    This table gives a general sense of what to expect. Freshers should prioritize tools that offer professional templates, ATS optimization, and easy export formats, as these directly impact interview calls.


    Detailed Breakdown: What Each Builder Excels At

    Professional Templates

    Resume builders with a strong collection of templates help freshers quickly choose a layout that communicates professionalism. Good templates balance whitespace, font choice, and the order of sections. Freshers should select templates that highlight education, internships, and projects at the top.

    AI Content Assistance

    AI-powered systems are beneficial for users who struggle with wording. They offer section suggestions such as objective statements, skills summary, and project descriptions. This not only reduces writing effort but increases relevancy to job requirements.

    ATS Friendly Formatting

    Applicant Tracking Systems filter out resumes that lack job-specific keywords. Builders with ATS insights ensure that resumes are readable by automated systems and human recruiters alike, improving chances of being shortlisted.


    Step-by-Step: How Freshers Should Build a Resume Using Online Builders

    Step 1: Choose the Right Format

    Most builders offer chronological, functional, or hybrid formats. Freshers usually benefit from a hybrid format that balances skills and academic details.

    Step 2: Input Personal and Contact Details

    Ensure name, phone number, professional email, and city are entered clearly. A professional resume includes only essential contact information.

    Step 3: Highlight Education First

    For freshers, the education section should appear before work experience. Include:

    • Degree name
    • Institution
    • Year of graduation
    • Percentage or CGPA (if strong)

    Step 4: Add Projects and Internships

    Even small internships, live projects, certifications, or volunteer work add value. Focus on your role and key achievement in each.

    Step 5: List Skills Clearly

    Use builder suggestions to add hard skills (software, coding languages, tools) and soft skills (communication, teamwork).

    Step 6: Optimize for Job Description

    Review the job requirements and adjust keywords in your resume sections to match the role.

    Step 7: Download and Review

    Export the resume as PDF or Word. Review spacing, font consistency, and section headers before submission.


    Common Mistakes Freshers Make in Resume Building

    • Overcrowding with irrelevant details
    • Lacking industry keywords
    • Poor formatting and large blocks of text
    • Excluding project descriptions
    • Using outdated templates

    Avoiding these mistakes increases the likelihood of securing interview calls.


    Benefits of Using Online Resume Builders Over Traditional Methods

    Online builders substantially reduce resume creation time. Studies suggest that resume builders can cut drafting time by 50 to 70 percent compared to traditional word processors, especially for users who lack design experience.

    Additionally, builders often provide prompts that encourage users to include details they might otherwise miss, such as:

    • Certifications
    • Tools familiarity
    • Objective statements

    These prompts help freshers build resumes that reflect both ability and potential.


    How Resume Builders Help Different Industries

    Information Technology

    Builders suggest relevant keywords such as Python, Java, SQL, and project-specific terms.

    Finance and Accounting

    Resume sections highlight coursework, internships, and software tools like Excel.

    Marketing and HR

    Builders focus on communication skills, campaign projects, and personality strengths.

    Builders tailor suggestions based on the chosen job field, improving role relevance.


    Tips to Maximize Resume Builder Effectiveness

    • Use professional language and active verbs
    • Avoid generic statements like “hardworking”
    • Quantify achievements where possible
    • Update resume with relevant keywords per application
    • Create variants for different job roles

    Conclusion: Choosing the Best Online Resume Builder for Freshers

    Selecting the best online resume builder for freshers depends on your career goals, job field, and comfort with technology. Builders with strong template libraries, AI content suggestions, and ATS optimization offer the best outcomes, especially when competition is stiff.

    Freshers should choose tools that help them highlight their strengths, present information clearly, and align keywords with job descriptions.

    Structured resume creation through reliable builders gives freshers an edge in securing interview opportunities and accelerating career beginnings.


    Frequently Asked Questions (FAQ)

    1. What makes an online resume builder suitable for freshers?

    An online resume builder suitable for freshers offers easy templates, suggestions, and guidance to highlight education and skills without extensive work history.

    2. Are resumes created with online builders accepted by employers?

    Yes, resumes created with online builders are widely accepted and often look more professional than manually formatted ones.

    3. Should freshers include internships and projects?

    Yes, internships and academic projects are valuable and should be featured prominently on a fresher resume.

    4. Can resume builders help with industry-specific resumes?

    Many resume builders provide industry templates and keyword suggestions that make your resume more relevant to specific fields.

    5. Does using a resume builder improve interview chances?

    Yes, resume builders help format content more effectively and include important keywords, increasing visibility to recruiters.

    6. How long should a fresher’s resume be?

    A one-page resume is ideal for freshers to keep information concise and relevant.

    7. Is it necessary to customize the resume for each job application?

    Yes, customizing resumes for each application improves chances by aligning your skills with the job requirements.


    Disclaimer

    This article is for informational and educational purposes only. The descriptions and suggestions provided are based on general observations and industry practices. Individual user needs and preferences may vary.