Tag: Excel Career Skills

  • Dynamic Array Formulas in Excel Explained: Complete Beginner to Advanced Guide with Examples (2026)

    Understanding Dynamic Array Formulas in Excel Explained is essential for anyone who wants to work faster, smarter, and more efficiently in modern Excel. Dynamic arrays have completely changed how formulas behave, allowing a single formula to return multiple results automatically without the need for Ctrl+Shift+Enter.

    In the first 100 words, it’s important to highlight that dynamic arrays are one of the most powerful upgrades in Excel in the last decade. Introduced in newer versions of Excel, they eliminate the need for complex formulas and helper columns. Studies and user feedback suggest that dynamic arrays can reduce formula complexity by up to 60% and improve productivity significantly for data analysts, MIS professionals, and accountants.


    What Are Dynamic Array Formulas in Excel?

    Dynamic array formulas are formulas that can return multiple values and automatically “spill” them into adjacent cells. Instead of writing separate formulas for each cell, one formula dynamically fills a range.

    Key Concept: Spill Behavior

    When you enter a dynamic array formula, Excel automatically places the results in multiple cells. This is known as a “spill range.”

    Example:
    If a formula returns 5 results, Excel will automatically fill 5 cells.


    Why Dynamic Arrays Are a Game-Changer

    Dynamic arrays simplify data analysis and reduce manual effort. Here’s why they are important:

    • No need for array formulas using Ctrl+Shift+Enter
    • Reduced formula errors
    • Faster data processing
    • Cleaner and more readable spreadsheets
    • Automatic updates when data changes

    Professionals using dynamic arrays report 30–50% faster report creation, especially in dashboards and MIS reporting.


    Key Dynamic Array Functions in Excel

    Below are the most important dynamic array functions you must learn:

    FunctionPurpose
    FILTERExtracts data based on conditions
    SORTSorts data dynamically
    SORTBYSorts using another column
    UNIQUERemoves duplicates
    SEQUENCEGenerates number sequences
    RANDARRAYCreates random numbers
    XLOOKUPAdvanced lookup with dynamic output

    FILTER Function Explained with Example

    The FILTER function extracts data based on conditions.

    Syntax:

    =FILTER(array, condition)

    Example:

    =FILTER(A2:A10, B2:B10=”Yes”)

    This will return only values where the condition is met.

    Use Case:

    • Filtering sales data
    • Extracting specific records
    • Creating dynamic reports

    SORT and SORTBY Functions

    SORT Function

    Sorts data automatically.

    Example:
    =SORT(A2:A10)

    SORTBY Function

    Sorts data based on another column.

    Example:
    =SORTBY(A2:A10, B2:B10)

    Use Case:

    • Ranking data
    • Organizing reports

    UNIQUE Function – Remove Duplicates Instantly

    The UNIQUE function extracts only distinct values.

    Example:

    =UNIQUE(A2:A10)

    Benefits:

    • No need for manual duplicate removal
    • Automatically updates when data changes

    SEQUENCE Function – Generate Data Automatically

    SEQUENCE creates a list of numbers.

    Example:

    =SEQUENCE(10)

    This generates numbers from 1 to 10.

    Use Case:

    • Creating serial numbers
    • Generating date sequences

    RANDARRAY Function – Random Data Generation

    Generates random numbers dynamically.

    Example:

    =RANDARRAY(5)

    Use Case:

    • Sample data creation
    • Testing scenarios

    XLOOKUP with Dynamic Arrays

    XLOOKUP can return multiple results when used with dynamic arrays.

    Example:

    =XLOOKUP(“Product A”, A2:A10, B2:B10)

    Advantage:

    • More flexible than VLOOKUP
    • Works both vertically and horizontally

    Understanding Spill Range and Spill Errors

    Dynamic arrays automatically spill results into adjacent cells. However, sometimes errors occur.

    Common Spill Issues:

    IssueSolution
    Blocked cellsClear the cells in spill range
    Merged cellsRemove merged cells
    Insufficient spaceExpand available area

    The “#SPILL!” error is common but easy to fix.


    Real-World Applications of Dynamic Array Formulas

    Dynamic arrays are widely used in:

    MIS Reporting

    Automating dashboards and reports

    Financial Analysis

    Quick calculations and projections

    Data Cleaning

    Removing duplicates and filtering data

    HR Management

    Employee data sorting and analysis

    Sales Reports

    Dynamic filtering and ranking

    Companies using advanced Excel functions report up to 40% reduction in manual work.


    Dynamic Arrays vs Traditional Excel Formulas

    FeatureDifference
    OutputSingle cell vs multiple cells
    ComplexityHigh vs simplified
    SpeedSlower vs faster
    MaintenanceDifficult vs easy

    Dynamic arrays clearly outperform traditional methods.


    Tips to Master Dynamic Array Formulas

    Use Structured Data

    Keep your data organized in tables.

    Avoid Manual Copying

    Let formulas spill automatically.

    Combine Functions

    Use FILTER + SORT + UNIQUE together.

    Practice Real Scenarios

    Work on dashboards and reports.

    Stay Updated

    New Excel functions are continuously added.


    Common Mistakes to Avoid

    • Blocking spill ranges
    • Using old Excel versions
    • Mixing dynamic and traditional formulas incorrectly
    • Ignoring data structure

    Avoiding these mistakes can improve efficiency significantly.


    Future of Excel with Dynamic Arrays

    Dynamic arrays are just the beginning. Excel is moving towards:

    • AI-powered formulas
    • Automated insights
    • Real-time collaboration
    • Advanced data modeling

    Learning dynamic arrays today prepares you for the future of data analysis.


    How Learning Dynamic Arrays Can Boost Your Career

    Professionals who master dynamic arrays:

    • Work faster and smarter
    • Create advanced dashboards
    • Handle large datasets easily
    • Stand out in job interviews

    In India, Excel skills are required in over 70% of data-related jobs, making it a critical skill.


    Upgrade Your Excel Skills (Recommended Course)

    If you want to master Excel from beginner to advanced level, including dynamic arrays, automation, dashboards, VBA, and real-world projects, you can explore this professional course:

    MIS Professional Excel Course with VBA, Access & SQL

    This course is designed to help you become job-ready and handle real business scenarios confidently.


    Conclusion

    Understanding Dynamic Array Formulas in Excel Explained is no longer optional—it is essential for modern Excel users. These formulas simplify complex tasks, reduce errors, and significantly improve productivity.

    Whether you are a student, accountant, MIS executive, or data analyst, mastering dynamic arrays will give you a strong advantage in your career.


    FAQ (Featured Snippet Optimized)

    What are dynamic array formulas in Excel?

    Dynamic array formulas return multiple results and automatically fill adjacent cells.

    What is a spill range in Excel?

    A spill range is the area where the results of a dynamic array formula are displayed.

    What causes #SPILL error?

    It occurs when the spill range is blocked or insufficient space is available.

    Which Excel versions support dynamic arrays?

    Dynamic arrays are available in Excel 365 and Excel 2021.

    What is the use of FILTER function?

    It extracts data based on specific conditions dynamically.

    Are dynamic arrays better than traditional formulas?

    Yes, they are faster, simpler, and more efficient.

    Can beginners learn dynamic arrays easily?

    Yes, with practice and examples, beginners can learn quickly.


    Disclaimer

    This article is for educational purposes only. Features and functions may vary depending on Excel versions. Readers should practice formulas before applying them in professional scenarios.
  • Excel Mastery Course for MIS Professionals: What You’ll Learn, Career Benefits, and Why It Truly Matters

    Why an Excel Mastery Course Is No Longer Optional

    In today’s data-driven workplace, an Excel Mastery Course is no longer a “good-to-have” skill—it has become a professional necessity. From MIS executives and accountants to analysts and operations teams, Excel remains the most widely used business tool worldwide. Industry research consistently shows that over 80% of corporate data analysis and internal reporting is still performed using Excel.

    This Excel Mastery Course is designed to take learners beyond basic spreadsheets and into real-world professional usage—covering formulas, dashboards, MIS reports, automation, and macros. If you want to work faster, reduce errors, and become indispensable at your workplace, this structured Excel program offers a clear, practical path.
    You can explore the complete course structure and curriculum here:
    Excel Mastery Course


    What Is an Excel Mastery Course?

    An Excel Mastery Course is a comprehensive learning program that focuses on how Excel is actually used in corporate environments. Unlike beginner tutorials that stop at basic formulas, this course emphasizes:

    • Business-oriented Excel workflows
    • Practical MIS and management reporting
    • Automation using VBA macros
    • Handling large and complex datasets
    • Accuracy, speed, and professional presentation

    The objective is not just learning Excel features but developing job-ready Excel expertise.


    Who Should Enroll in This Excel Mastery Course?

    This Excel Mastery Course is suitable for a wide range of learners:

    • MIS Executives and Reporting Professionals
    • Accountants and Finance Executives
    • Data Entry Operators aiming for career growth
    • Students preparing for corporate roles
    • Business owners managing internal reports
    • Working professionals seeking automation skills

    Surveys across job portals indicate that professionals with advanced Excel skills earn 20%–35% higher compensation than those limited to basic Excel usage.


    What You’ll Learn in This Excel Mastery Course

    Strong Excel Fundamentals for Long-Term Mastery

    Every advanced Excel professional relies on a strong foundation. This Excel Mastery Course ensures that fundamentals are clear and practical.

    Focus AreaProfessional Outcome
    Excel NavigationFaster workflow and efficiency
    Data Entry Best PracticesReduced manual errors
    Formatting StandardsCorporate-ready reports

    Advanced Excel Formulas and Logical Functions

    Formulas are at the core of productivity. This Excel Mastery Course trains learners to think logically, not just memorize formulas.

    Formula CategoryBusiness Application
    Lookup FunctionsFast data retrieval
    Logical FunctionsAutomated decisions
    Date & Time FunctionsAccurate timelines
    Text FunctionsClean, standardized data

    Professionals using advanced Excel formulas report up to 60% time savings in recurring reports.


    MIS Reporting and Data Analysis

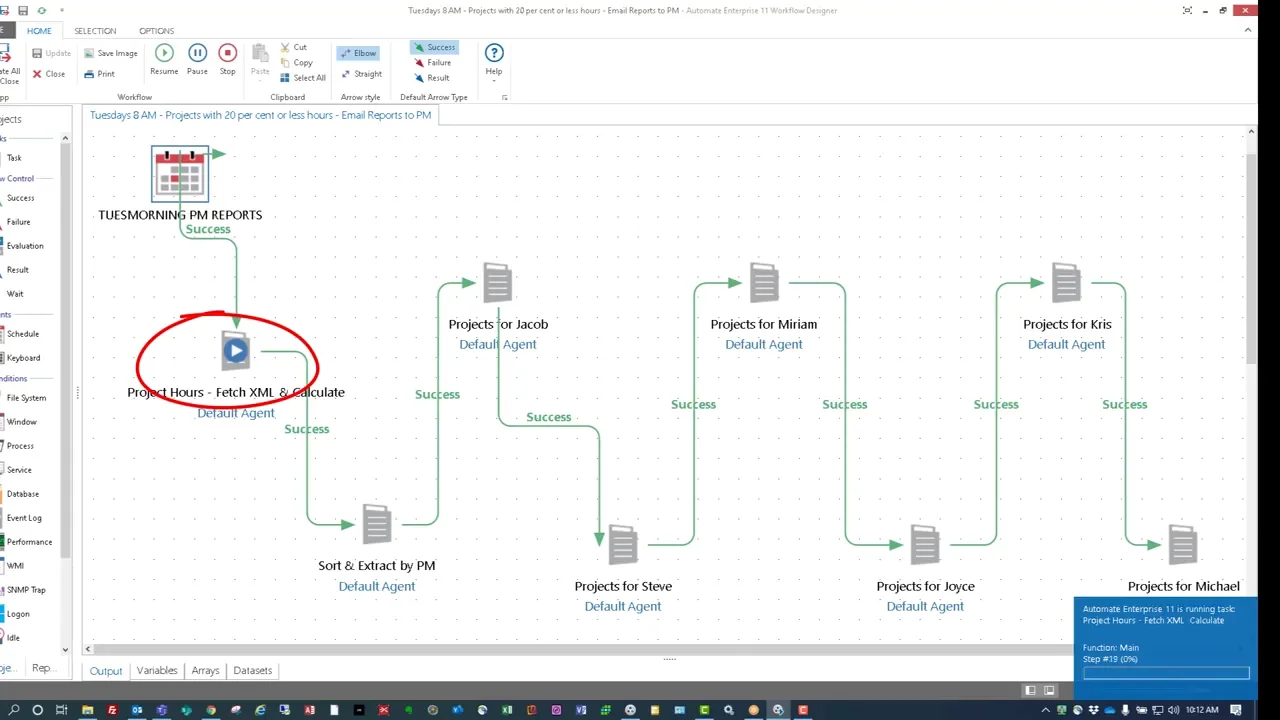
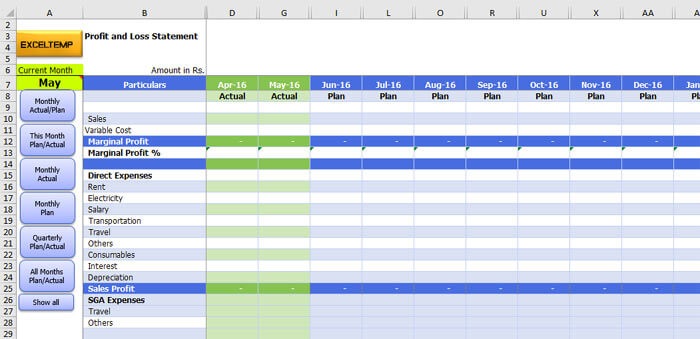
    MIS reporting skills are among the most in-demand Excel capabilities. This Excel Mastery Course focuses heavily on converting raw data into meaningful management information.

    https://www.finereport.com/en/wp-content/uploads/2020/04/2020042901I.jpg
    https://www.goskills.com/blobs/blogs/165/1.gif
    https://www.smartsheet.com/sites/default/files/styles/1300px/public/IC-Project-Management-Dashboard.png?itok=WmxgwjZi

    4

    MIS SkillBusiness Value
    Pivot TablesQuick data summaries
    Dynamic ReportsAutomated monthly MIS
    Data ValidationError-free reporting

    Organizations using structured MIS reports improve decision-making speed by nearly 40%.


    Charts, Graphs, and Interactive Dashboards

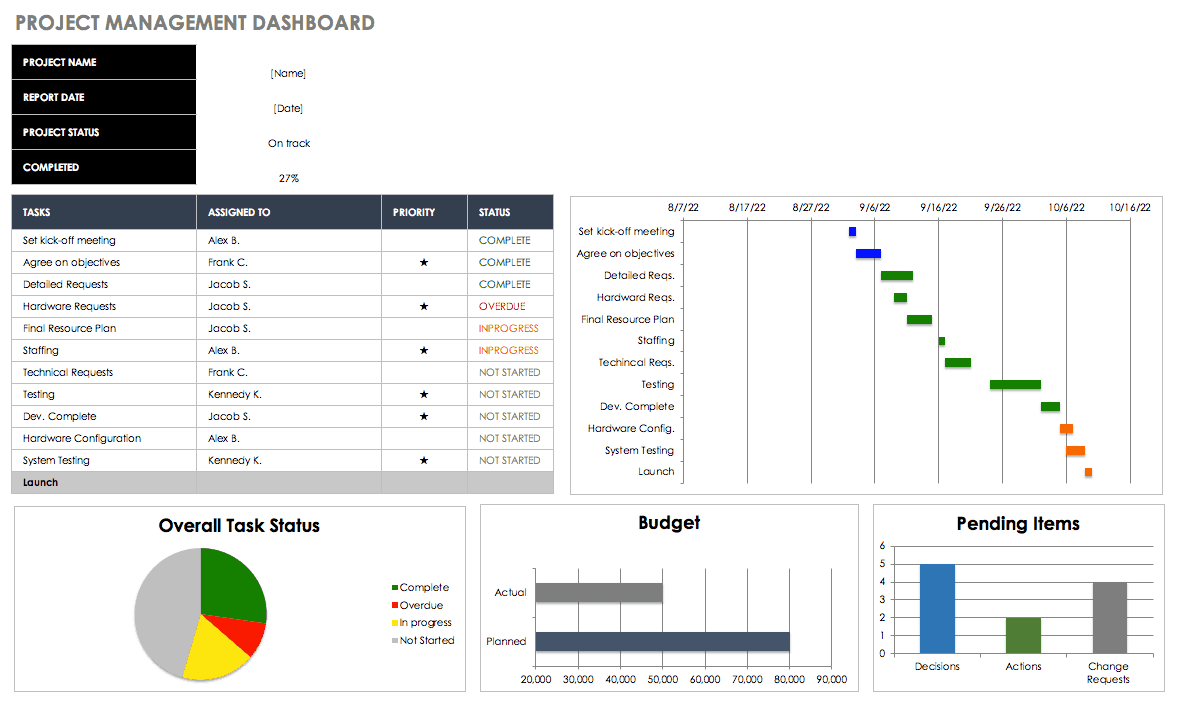
    One of the strongest components of this Excel Mastery Course is dashboard creation. Dashboards allow management to understand performance at a glance.

    Dashboard ElementPurpose
    Interactive ChartsTrend analysis
    KPI TrackersPerformance monitoring
    Linked Data ModelsAuto-updating visuals

    Well-designed Excel dashboards often replace costly business intelligence tools in small and medium organizations.


    VBA Macros and Excel Automation

    Automation separates average Excel users from professionals. This Excel Mastery Course introduces VBA macros in a simple, business-focused way.

    https://media.licdn.com/dms/image/v2/C4E12AQGLW3mwNbrlLg/article-cover_image-shrink_600_2000/article-cover_image-shrink_600_2000/0/1546088818884?e=2147483647&t=DIzoaSN0hxDHxRXjHPP6hJlqRBouuBhz5Vbucd7seQg&v=beta
    https://embed-ssl.wistia.com/deliveries/a17b301260d7da2b75e194f4fafa387b.webp?image_crop_resized=1280x720

    4

    Automation AreaProductivity Gain
    Repetitive TasksUp to 90% time reduction
    Report GenerationMinutes instead of hours
    Data CleaningFully automated processes

    Even basic automation can save 100+ working hours per year for a single professional.
    To understand how automation and MIS reporting are structured in detail, you can review the full course outline here:
    Excel Mastery Course


    Handling Large and Complex Data Sets

    Many professionals struggle with large Excel files. This Excel Mastery Course teaches efficient methods to manage and analyze heavy datasets without slowing down.

    SkillReal-World Impact
    Advanced FilteringFaster insights
    Data Cleaning TechniquesReliable reports
    Error HandlingMinimal rework

    Companies lose significant productivity due to poor data handling. Structured Excel workflows dramatically reduce this loss.


    Why This Excel Mastery Course Matters for Your Career

    Excel Skills Are Tested in Interviews

    Recruitment studies show that 7 out of 10 employers test Excel skills during interviews for MIS, finance, and analyst roles.

    Faster Career Growth

    Professionals who can independently manage reports, dashboards, and automation are often promoted faster due to their reliability and efficiency.

    Reduced Dependency

    Excel mastery reduces dependence on IT teams and external tools for routine data tasks.

    Freelancing and Side Income

    Advanced Excel professionals often earn additional income by creating dashboards, automating reports, or offering MIS consulting services.

    If you are serious about upgrading your Excel skills for long-term career growth, this complete Excel Mastery Course can be accessed here:
    Check Here


    What Makes This Excel Mastery Course Different?

    This Excel Mastery Course stands out because it focuses on:

    • Real corporate use cases
    • Practical assignments
    • Professional MIS formats
    • Automation-driven efficiency
    • Step-by-step progression from basics to advanced

    The learning approach ensures that skills are immediately applicable in real job environments.


    Learning Outcomes You Can Expect

    After completing this Excel Mastery Course, learners typically experience:

    • Faster report preparation
    • Improved data accuracy
    • Confidence in management reporting
    • Ability to automate daily tasks
    • Strong professional recognition

    Many learners report productivity improvements of 2x to 3x within weeks of applying these skills.


    Frequently Asked Questions (FAQ)

    What makes this an Excel Mastery Course instead of a basic Excel course?

    This Excel Mastery Course focuses on MIS reporting, automation, dashboards, and VBA rather than only basic spreadsheet features.

    Is this Excel Mastery Course suitable for beginners?

    Yes. The course starts from core fundamentals and gradually moves to advanced professional concepts.

    Will this Excel Mastery Course help with MIS and reporting jobs?

    Yes. MIS reporting is one of the main focuses of this Excel Mastery Course.

    Does the course include practical exercises?

    Yes. Real-world datasets and business-style assignments are used throughout.

    Is VBA difficult for non-technical learners?

    No. VBA is taught in a simple, step-by-step manner focused on business automation.

    Can this Excel Mastery Course help in salary growth?

    Professionals with advanced Excel skills often experience faster promotions and better salary increments.

    Is this Excel Mastery Course useful outside accounting and MIS roles?

    Yes. Excel mastery is valuable across finance, operations, sales, HR, and analytics roles.


    Conclusion: Why Excel Mastery Is a Smart Investment

    Excel is more than software—it is a career accelerator. A well-structured Excel Mastery Course equips you with skills that improve accuracy, efficiency, and professional value. In a competitive job market, strong Excel capabilities often become the deciding factor between average performance and career growth.


    Disclaimer

    This article is intended for educational and informational purposes only. Individual results may vary depending on effort, practice, and professional background. This content does not guarantee employment or salary increases but aims to enhance practical Excel proficiency.


  • 100 Excel Shortcuts to Boost Productivity and Save Hours at Work

    If you want to save hours every week and become the fastest Excel user in your office, then mastering keyboard shortcuts is the smartest move. They not only speed up your work but also make you look like a true Excel pro.

    100 Excel Shortcuts with Explanations

    Here’s a categorized list so you can learn easily:


    🔹 Basic Shortcuts

    1. Ctrl + N – Create a new workbook instantly.
    2. Ctrl + O – Open an existing workbook.
    3. Ctrl + S – Save the current file.
    4. F12 – Save As dialog box.
    5. Ctrl + P – Print your sheet.
    6. Ctrl + W – Close the current workbook.
    7. Ctrl + F4 – Close Excel completely.
    8. Ctrl + Z – Undo the last action.
    9. Ctrl + Y – Redo the last undone action.
    10. Ctrl + C – Copy selected cells.

    🔹 Navigation Shortcuts

    1. Ctrl + Arrow Keys – Jump to the last filled cell in that direction.
    2. Ctrl + Home – Go to the first cell (A1).
    3. Ctrl + End – Go to the last used cell.
    4. Page Up/Page Down – Move one screen up/down.
    5. Alt + Page Up/Down – Move one screen left/right.
    6. Tab/Shift + Tab – Move right/left in a row.
    7. Ctrl + G (F5) – Go to a specific cell.
    8. Ctrl + F – Find anything in the sheet.
    9. Ctrl + H – Replace text or values.
    10. Ctrl + Backspace – Show active cell.

    🔹 Data Entry & Editing

    1. F2 – Edit the active cell.
    2. Alt + Enter – Insert a line break inside a cell.
    3. Ctrl + D – Fill down from the above cell.
    4. Ctrl + R – Fill right from the left cell.
    5. Ctrl + ; – Insert today’s date.
    6. Ctrl + Shift + : – Insert current time.
    7. Ctrl + Shift + “+” – Insert new row/column.
    8. Ctrl + “-“ – Delete selected row/column.
    9. Ctrl + Space – Select entire column.
    10. Shift + Space – Select entire row.

    🔹 Formatting Shortcuts

    1. Ctrl + B – Bold text.
    2. Ctrl + I – Italic text.
    3. Ctrl + U – Underline text.
    4. Alt + H + O + I – Auto-fit column width.
    5. Alt + H + O + A – Auto-fit row height.
    6. Ctrl + 1 – Format cells dialog box.
    7. Ctrl + Shift + $ – Apply currency format.
    8. Ctrl + Shift + % – Apply percentage format.
    9. Ctrl + Shift + # – Apply date format.
    10. Ctrl + Shift + @ – Apply time format.

    🔹 Selection Shortcuts

    1. Ctrl + A – Select all cells in sheet.
    2. Ctrl + Shift + Arrow Keys – Select range to last filled cell.
    3. Shift + Arrow Keys – Select cells one by one.
    4. Ctrl + Shift + End – Select from current cell to last used cell.
    5. Ctrl + Shift + Home – Select from current cell to A1.
    6. Ctrl + * (asterisk) – Select current data region.
    7. Shift + Space + Ctrl – Select entire worksheet.
    8. F8 – Extend selection mode.
    9. Shift + F8 – Add non-adjacent cells to selection.
    10. Alt + ; – Select only visible cells.

    🔹 Formula Shortcuts

    1. Alt + = – AutoSum quickly.
    2. Shift + F9 – Calculate selected cells.
    3. F9 – Calculate all sheets.
    4. Ctrl + ` (grave accent) – Show formulas instead of results.
    5. Ctrl + Shift + Enter – Enter array formula.
    6. Ctrl + Shift + A – Insert function arguments.
    7. Shift + F3 – Insert function window.
    8. Ctrl + Shift + L – Apply/remove filters.
    9. Alt + Down Arrow – Open filter dropdown.
    10. Ctrl + [ – Trace dependent cells.

    🔹 Worksheet Shortcuts

    1. Ctrl + Page Up – Move to previous sheet.
    2. Ctrl + Page Down – Move to next sheet.
    3. Shift + F11 – Insert new worksheet.
    4. Alt + E + L – Delete current worksheet.
    5. Ctrl + 9 – Hide selected rows.
    6. Ctrl + Shift + 9 – Unhide rows.
    7. Ctrl + 0 – Hide selected columns.
    8. Ctrl + Shift + 0 – Unhide columns.
    9. Alt + O + H + R – Rename sheet.
    10. Ctrl + Drag Sheet Tab – Copy worksheet.

    🔹 Advanced & Miscellaneous

    1. Alt + F1 – Create a chart in same sheet.
    2. F11 – Create chart in new sheet.
    3. Ctrl + K – Insert hyperlink.
    4. Ctrl + Alt + V – Paste Special dialog box.
    5. Ctrl + Shift + V – Paste values only.
    6. Ctrl + Alt + T – Insert table.
    7. Ctrl + Shift + O – Select cells with comments.
    8. Shift + F2 – Edit comment.
    9. Ctrl + Alt + F9 – Recalculate all worksheets.
    10. Alt + F8 – Open macro dialog box.

    🔹 Time-Saving Favorites

    1. Ctrl + T – Create table from data.
    2. Alt + H + S + I – Insert sparkline.
    3. Ctrl + Shift + K – Insert hyperlink quickly.
    4. Ctrl + Shift + U – Expand/Collapse formula bar.
    5. Alt + H + V + S – Paste Special with options.
    6. Alt + H + D + C – Delete column.
    7. Alt + H + D + R – Delete row.
    8. Alt + A + M – Remove duplicates.
    9. Alt + N + P – Insert pivot table.
    10. Alt + F + T – Excel options.

    🔹 Final 10 Power Shortcuts

    1. Ctrl + Alt + Shift + F9 – Force full calculation.
    2. Alt + F11 – Open VBA editor.
    3. Alt + Q – Close VBA editor.
    4. Ctrl + Shift + F3 – Create named ranges.
    5. Ctrl + F3 – Name manager.
    6. Alt + A + T – Apply text to columns.
    7. Alt + H + O + I – Auto-fit column width.
    8. Ctrl + Shift + ! – Apply number format.
    9. Alt + D + F + F – Freeze panes.
    10. Alt + W + F + F – Toggle freeze panes.

    ✅ Final Tip

    Don’t try to memorize all 100 shortcuts in one go. Start with 10 most useful ones (like Copy, Paste Special, AutoSum, Filters, and Navigation). Once they become second nature, add 5–10 more every week. Within a month, you’ll be working twice as fast as before—and easily become the “Excel Champion” in your office.


    Subscribe to our newsletter!

    [newsletter_form type=”minimal”]
  • Top 10 Excel Functions Every Data Analyst Must Master

    When Rohan, a 26-year-old commerce graduate from Pune, started preparing for his first data analyst interview, he quickly realized one thing – Excel is not just a spreadsheet tool, it’s a career-making skill.

    He had always used Excel for basic sums and formatting, but during mock interviews, he froze when asked,

    “Can you combine INDEX and MATCH to find a sales figure for a product in a given month?”

    That day, Rohan decided – No more guesswork. I will master the top Excel functions recruiters expect.
    Here’s what he learned, with examples from his practice sessions.


    1. VLOOKUP / XLOOKUP – Rohan’s ‘Data Detective’ Tool

    One day, Rohan had two datasets – one with Product Names, another with Sales Values.
    Instead of scrolling endlessly, he used:

    =XLOOKUP("Mango Juice", A2:A100, B2:B100, "Not Found")
    

    Result: Sales value for Mango Juice in seconds.
    Lesson: Lookup functions save hours in data matching.


    2. INDEX + MATCH – Rohan’s Upgrade

    During an interview test, the product name was in column C, and sales were in column A.
    VLOOKUP couldn’t help (it needs the lookup column first).
    Rohan used:

    =INDEX(A2:A100, MATCH("Mango Juice", C2:C100, 0))
    

    Lesson: INDEX+MATCH works in any direction and is interview gold.


    3. TEXT Functions – Cleaning Rohan’s Messy Data

    His dataset had customer IDs like " AB1234 " with spaces.
    He cleaned it using:

    =TRIM(A2)
    

    And extracted first 2 letters for state code:

    =LEFT(A2, 2)
    

    Lesson: TEXT functions like LEFT, RIGHT, MID, TRIM, and LEN are must-haves for messy datasets.


    4. IF + IFS – Decision Maker

    When given sales targets, Rohan categorized them:

    =IF(B2>=100000, "Top Performer", "Needs Improvement")
    

    For multiple conditions:

    =IFS(B2>=100000, "Top Performer", B2>=50000, "Average", TRUE, "Low")
    

    Lesson: IF helps classify data instantly.


    5. SUMIF / SUMIFS – Finding Patterns

    To know the total sales for “Mango Juice” in the “East” region:

    =SUMIFS(Sales, Product, "Mango Juice", Region, "East")
    

    Lesson: SUMIFS is perfect for quick conditional aggregations.


    6. COUNTIF / COUNTIFS – Counting What Matters

    In one dataset, Rohan needed to know how many orders were above ₹5,000:

    =COUNTIF(Sales, ">5000")
    

    Lesson: COUNT functions are quick ways to spot trends in large datasets.


    7. FILTER – Rohan’s Shortcut to Relevant Data

    Instead of applying Excel’s manual filter, Rohan extracted all sales for the “North” region with:

    =FILTER(A2:D100, Region="North")
    

    Lesson: Dynamic, criteria-based extraction beats manual filtering.


    8. UNIQUE – Finding Distinct Customers

    When asked for the number of unique buyers, Rohan did:

    =UNIQUE(CustomerName)
    

    Lesson: UNIQUE quickly deduplicates lists for better analysis.


    9. Date Functions – Time Travel in Excel

    Rohan needed monthly trends. He used:

    =TEXT(OrderDate, "MMM-YYYY")
    

    For month-end date:

    =EOMONTH(OrderDate, 0)
    

    Lesson: Date functions help slice and dice time-based data.


    10. Power Query + Power Pivot – Rohan’s Secret Weapon

    By now, Rohan could clean data in Power Query, load millions of rows, and use DAX for calculated measures.
    In one interview, he impressed the panel by transforming raw CSV files into a dashboard-ready table in 10 minutes.


    Rohan’s Takeaway

    “Excel isn’t about knowing formulas by heart—it’s about knowing which function to use when, and how to combine them.”

    Master these 10 functions, and you’re not just prepared for a data analyst job—you’re prepared for real-world problem solving.