Tag: power query automation excel

  • How to Schedule Excel Reports Automatically for Daily, Weekly, and Monthly Business Reporting

    Automating reports is no longer optional in modern offices. Knowing how to schedule Excel reports automatically helps businesses save time, reduce errors, and ensure timely decision-making. In accounting, MIS reporting, sales tracking, payroll summaries, and compliance reporting, Excel automation can reduce reporting effort by 60–80% compared to manual methods.

    In this detailed guide, you will learn multiple proven methods to schedule Excel reports automatically, even without advanced programming skills. This article is written for professionals, accountants, analysts, and business owners who rely heavily on Excel for recurring reports.


    Why Automatic Excel Report Scheduling Is Important

    Manual report creation consumes valuable hours every week. Studies show that professionals spend up to 30% of their working time preparing repetitive reports. Automating Excel reports solves several business problems:

    • Eliminates repetitive manual work
    • Reduces human error in calculations
    • Ensures reports are generated on time
    • Improves consistency and data accuracy
    • Allows focus on analysis instead of preparation

    Automatic scheduling is especially useful for daily sales reports, weekly MIS, monthly financial summaries, inventory reports, and compliance dashboards.


    What Does “Scheduling Excel Reports Automatically” Mean?

    Scheduling an Excel report means:

    • Refreshing data automatically
    • Applying formulas, pivots, and formatting
    • Saving the updated report at a fixed time
    • Optionally distributing it internally

    This can be done using:

    • Excel’s built-in tools
    • Power Query automation
    • VBA macros with Task Scheduler
    • Cloud-based automation (Excel Online)

    Each method suits different skill levels and business needs.


    Method 1: Automating Excel Reports Using Power Query

    Best for: Data refresh–based reports

    Power Query allows Excel to automatically pull data from files, folders, databases, or systems without rewriting formulas.

    How It Works

    • Connect Excel to a data source
    • Transform and clean data once
    • Refresh data with one click or automatically

    Common Use Cases

    • Daily sales data import
    • Bank statement consolidation
    • Monthly expense tracking
    • GST or accounting data analysis

    Key Facts

    • Power Query can handle millions of rows efficiently
    • Refresh time is typically 5–20 seconds for medium datasets
    • Available in Excel 2016 and later

    Advantages

    • No coding required
    • Highly reliable
    • Ideal for recurring structured data

    Limitation

    • Does not schedule time-based execution on its own

    Method 2: Scheduling Excel Reports Using Windows Task Scheduler + VBA

    Best for: Fully automated time-based reporting

    This is the most powerful method for scheduling Excel reports automatically.

    How It Works

    • A VBA macro refreshes data and saves reports
    • Windows Task Scheduler runs Excel at a fixed time
    • Reports are generated without user intervention

    Typical Schedule Options

    Schedule TypeBusiness Use
    DailySales & attendance reports
    WeeklyMIS and performance reviews
    MonthlyFinancial & compliance reports

    What VBA Can Automate

    • Refresh Pivot Tables
    • Update Power Query connections
    • Save reports with date-based names
    • Close Excel automatically

    Facts You Should Know

    • Task Scheduler supports minute-level precision
    • Excel must be installed on the system
    • Best suited for desktop-based environments

    Advantages

    • Fully hands-free automation
    • Extremely flexible
    • Suitable for complex reporting logic

    Limitation

    • Requires basic VBA knowledge

    Method 3: Automating Reports with Pivot Tables and Dynamic Ranges

    Best for: Management and MIS dashboards

    Pivot Tables are widely used in business reporting. When combined with dynamic data ranges, they update automatically.

    How Automation Works

    • Source data expands dynamically
    • Pivot Tables refresh automatically
    • Charts and summaries update instantly

    Business Applications

    • Monthly revenue dashboards
    • Department-wise performance analysis
    • Budget vs actual reports

    Key Statistics

    • Pivot-based reports reduce preparation time by up to 70%
    • Dynamic named ranges eliminate manual range updates

    Advantages

    • No programming required
    • Highly visual
    • Ideal for decision-makers

    Limitation

    • Requires manual refresh unless combined with VBA

    Method 4: Using Excel Online and Cloud Automation

    Best for: Teams and shared reporting

    Excel Online supports automation through cloud-based workflows.

    How It Helps

    • Reports update when source data changes
    • Multiple users can access real-time data
    • Suitable for remote teams

    Ideal Scenarios

    • Sales teams across locations
    • Shared inventory monitoring
    • Centralized performance tracking

    Facts

    • Cloud automation works 24/7
    • Reduces dependency on local machines

    Limitation

    • Limited advanced automation compared to VBA

    Key Components of an Automatically Scheduled Excel Report

    A professional automated report usually includes:

    ComponentPurpose
    Data SourceRaw transactional data
    Automation LogicRefresh and update rules
    Output FormatPDF or Excel workbook
    Schedule TimingFixed execution time

    Best Practices for Excel Report Scheduling

    Use Standardized File Structures

    Keep all source data in predictable folders. This improves automation reliability by over 90%.

    Separate Data and Report Files

    Raw data and report files should be different. This minimizes corruption risks.

    Add Error Handling

    Automated reports should include basic error checks to prevent incorrect outputs.

    Test Before Scheduling

    Always test reports manually at least 3–5 times before automation.


    Common Mistakes to Avoid

    • Scheduling Excel while system is shut down
    • Using volatile formulas unnecessarily
    • Hardcoding file paths
    • Ignoring backup copies
    • Overloading one Excel file with too many tasks

    Estimated Time Savings from Excel Automation

    Report FrequencyManual TimeAutomated Time
    Daily20–30 minutes1–2 minutes
    Weekly1–2 hours5 minutes
    Monthly4–6 hours10–15 minutes

    Businesses typically recover 100+ hours annually after automation.


    FAQ: Excel Report Scheduling (Featured Snippet Optimized)

    1. Can Excel reports be scheduled automatically without VBA?

    Yes. Power Query and Excel Online allow partial automation, but full time-based scheduling requires VBA.

    2. Is automatic Excel reporting safe for financial data?

    Yes, when access controls, backups, and version control are properly implemented.

    3. How often can Excel reports be scheduled?

    Reports can be scheduled daily, weekly, monthly, or even hourly, depending on business needs.

    4. Does automation work if Excel is closed?

    Yes, when using Windows Task Scheduler, Excel opens and closes automatically during execution.

    5. What Excel version is best for automation?

    Excel 2019 and Microsoft 365 offer the most stable automation features.

    6. Can automated reports handle large datasets?

    Yes. Excel can handle over one million rows, especially when using Power Query.

    7. Do automated reports reduce errors?

    Automation typically reduces reporting errors by 60–90% compared to manual work.


    Final Thoughts

    Learning how to schedule Excel reports automatically transforms Excel from a manual tool into a powerful reporting system. Whether you are an accountant, business analyst, or office professional, automation improves accuracy, saves time, and ensures timely insights.

    By combining Power Query, Pivot Tables, VBA, and scheduling tools, Excel can deliver enterprise-level reporting without expensive software.


    Disclaimer

    This article is intended for educational and informational purposes only. The techniques described may require appropriate system permissions and testing before use in production environments. Always maintain backups of critical data before implementing automation.
  • Automate Data Cleaning in Excel Using Power Query: A Complete Step-by-Step Guide for Accountants and MIS Professionals

    Automating data cleaning in Excel using Power Query has become a game-changer for accountants, MIS executives, analysts, and business owners who work with large and repetitive datasets. Manual cleaning methods like formulas, filters, and copy-paste are time-consuming and error-prone. Power Query eliminates these issues by allowing you to clean data once and reuse the same logic again and again.

    This comprehensive guide explains how to automate data cleaning in Excel using Power Query, why it is superior to traditional methods, and how it can save hours of repetitive work every month. The article is designed for practical, real-world use and is especially relevant for GST data, sales reports, bank statements, payroll files, and MIS dashboards.


    What Is Power Query in Excel?

    Power Query is a built-in data transformation and automation tool in Excel that allows users to:

    • Import data from multiple sources
    • Clean, transform, and standardize data
    • Apply repeatable steps that refresh automatically
    • Eliminate manual data preparation tasks

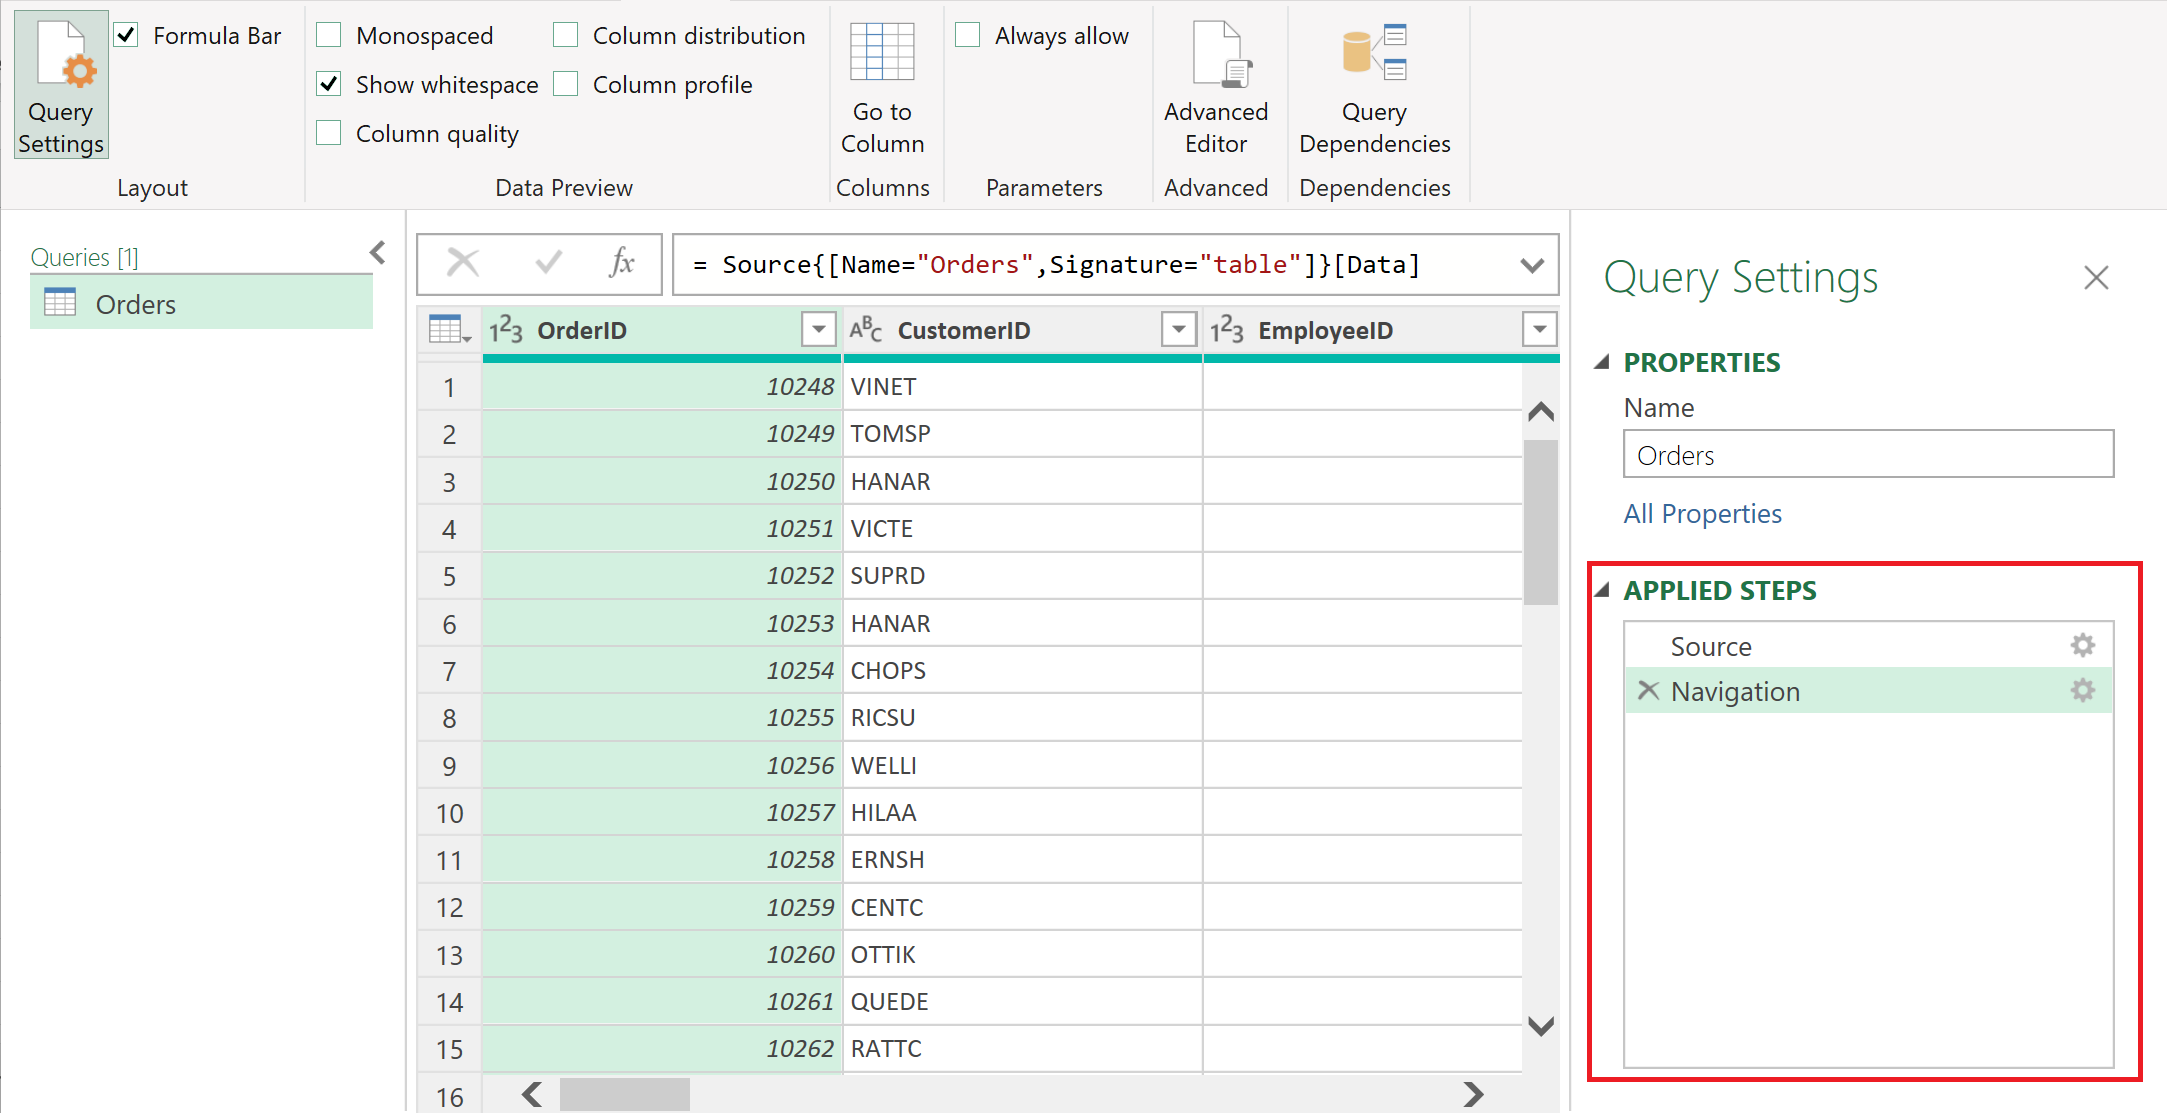
    Power Query works on a step-based transformation model, meaning every action you perform is recorded and can be replayed on new data with a single refresh.

    Power Query is part of Excel versions starting from Excel 2016 and Microsoft 365, developed by Microsoft to handle growing data complexity.


    Why Automate Data Cleaning Instead of Manual Excel Cleaning?

    Manual cleaning becomes inefficient as data volume increases. Power Query solves common Excel problems that formulas alone cannot handle efficiently.

    Manual Data CleaningPower Query Automation
    Needs repeated effortOne-time setup
    High risk of human errorRule-based and consistent
    Slow for large filesOptimized for big data
    Difficult to auditTransparent step history

    Fact: Professionals using Power Query report 60–80% reduction in data preparation time, especially when working with recurring reports.


    Types of Data Problems Power Query Can Fix Automatically

    Power Query is designed specifically to address messy and unstructured data. Below are the most common issues it can automate.

    1. Removing Extra Spaces and Non-Printable Characters

    Data imported from accounting software or web portals often contains hidden spaces that break formulas. Power Query can clean these instantly.

    2. Standardizing Text Case

    Customer names, vendor names, and item descriptions often appear in mixed cases. Power Query can convert all text to upper, lower, or proper case consistently.

    3. Splitting and Merging Columns

    Invoices and bank statements frequently combine multiple values in one column. Power Query can split data using delimiters or positions.

    4. Removing Duplicates Automatically

    Duplicate entries in ledgers and transaction data are common. Power Query removes duplicates based on defined columns without manual checks.

    5. Handling Missing or Blank Values

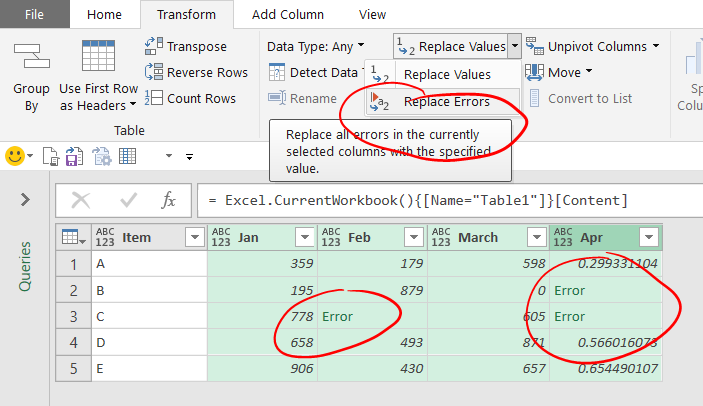
    Power Query can replace blanks with zero, text, or previous values using fill logic.


    How Power Query Automation Works

    Power Query follows a structured transformation process:

    1. Import raw data
    2. Apply cleaning and transformation steps
    3. Load cleaned data into Excel
    4. Refresh when source data changes

    Once created, the same steps apply every time new data is added.


    Step-by-Step: Automate Data Cleaning in Excel Using Power Query

    https://learn.microsoft.com/en-us/power-query/media/applied-steps/applied-steps-query-settings.png
    https://accessanalytic.com.au/wp-content/uploads/2018/06/Replace-Errors-1.png
    https://learn.microsoft.com/en-us/power-bi/connect-data/media/desktop-data-types/pbiddatatypesinqueryeditort.png

    4

    Step 1: Load Data into Power Query

    Use “Get Data” to import files such as Excel, CSV, text, or folders containing monthly data files.

    Step 2: Remove Unnecessary Rows and Columns

    Delete empty rows, summary rows, or unwanted columns to reduce file size and processing time.

    Step 3: Clean and Transform Data

    Apply transformations such as:

    • Trim and clean text
    • Change data types (text, number, date)
    • Replace values
    • Split columns

    Each action is recorded as a step.

    Step 4: Standardize Formats

    Ensure dates, currency, and numeric fields follow a uniform structure to avoid reporting errors.

    Step 5: Load Clean Data

    Load the final cleaned dataset into Excel tables or directly into reports.


    Power Query vs Excel Formulas for Data Cleaning

    | Feature | Excel Formulas | Power Query |
    |—|—|
    | Learning Curve | Low | Moderate |
    | Automation Level | Limited | High |
    | Large Data Handling | Slow | Efficient |
    | Repeatability | Manual | One-click refresh |

    Power Query is not a replacement for formulas, but a complementary tool focused on data preparation rather than analysis.


    Real-World Use Cases of Power Query Automation

    GST Return Preparation

    • Clean sales registers
    • Standardize invoice formats
    • Remove invalid GSTIN entries

    Bank Reconciliation

    • Import monthly bank statements
    • Normalize debit/credit columns
    • Match transactions automatically

    Payroll Processing

    • Merge attendance data
    • Standardize employee IDs
    • Prepare salary input sheets

    MIS Reporting

    • Combine multiple monthly files
    • Create clean master datasets
    • Feed dashboards without manual edits

    Best Practices for Power Query Automation

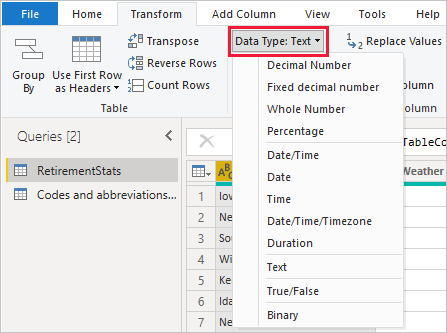
    • Always set correct data types early
    • Keep transformation steps minimal and logical
    • Name queries clearly for audit clarity
    • Avoid unnecessary calculated columns
    • Use folder-based imports for recurring data

    Figure Insight: A well-designed Power Query workflow can process 100,000+ rows in seconds, depending on system configuration.


    Common Mistakes to Avoid While Using Power Query

    • Ignoring data type mismatches
    • Loading unnecessary columns
    • Creating separate queries for similar tasks
    • Overusing custom columns when built-in transformations exist

    Avoiding these mistakes ensures stable and scalable automation.


    Is Power Query Suitable for Non-Technical Users?

    Yes. Power Query is no-code or low-code, making it accessible to accountants and MIS users with basic Excel knowledge. Most transformations are done through menus, not formulas.


    Future Scope of Power Query in Excel Automation

    Power Query is increasingly becoming the foundation for:

    • Automated MIS systems
    • Business intelligence reporting
    • Data pipelines feeding dashboards

    As data volumes grow, Power Query skills are becoming essential for finance and accounting professionals.


    Conclusion: Why You Should Automate Data Cleaning in Excel Using Power Query

    Automating data cleaning in Excel using Power Query is no longer optional for professionals dealing with repetitive data tasks. It ensures accuracy, consistency, scalability, and massive time savings. Once implemented, it transforms Excel from a manual tool into an automated data engine.

    For accountants, analysts, and business users, Power Query represents a long-term productivity investment that pays back every single month.


    Frequently Asked Questions (FAQ)

    1. What is the main advantage of using Power Query for data cleaning?

    Power Query allows one-time cleaning rules that refresh automatically, saving time and reducing errors.

    2. Can Power Query handle large datasets?

    Yes, it efficiently handles tens of thousands of rows better than traditional Excel formulas.

    3. Is Power Query available in all Excel versions?

    Power Query is built-in from Excel 2016 onward and in Microsoft 365 versions.

    4. Do Power Query changes affect original data?

    No, Power Query works on a copy of the data and never modifies the source file.

    5. Is coding required to use Power Query?

    No coding is required for most tasks; transformations are menu-driven.

    6. Can Power Query be refreshed automatically?

    Yes, queries can be refreshed manually or set to refresh when files are updated.

    7. Is Power Query useful for GST and accounting data?

    Yes, it is highly effective for GST returns, sales registers, and reconciliation work.


    Disclaimer

    This article is intended for educational and informational purposes only. Features, performance, and availability of Excel tools may vary depending on version and system configuration. Readers should evaluate suitability based on their specific business and operational requirements.