Tag: INDEX MATCH

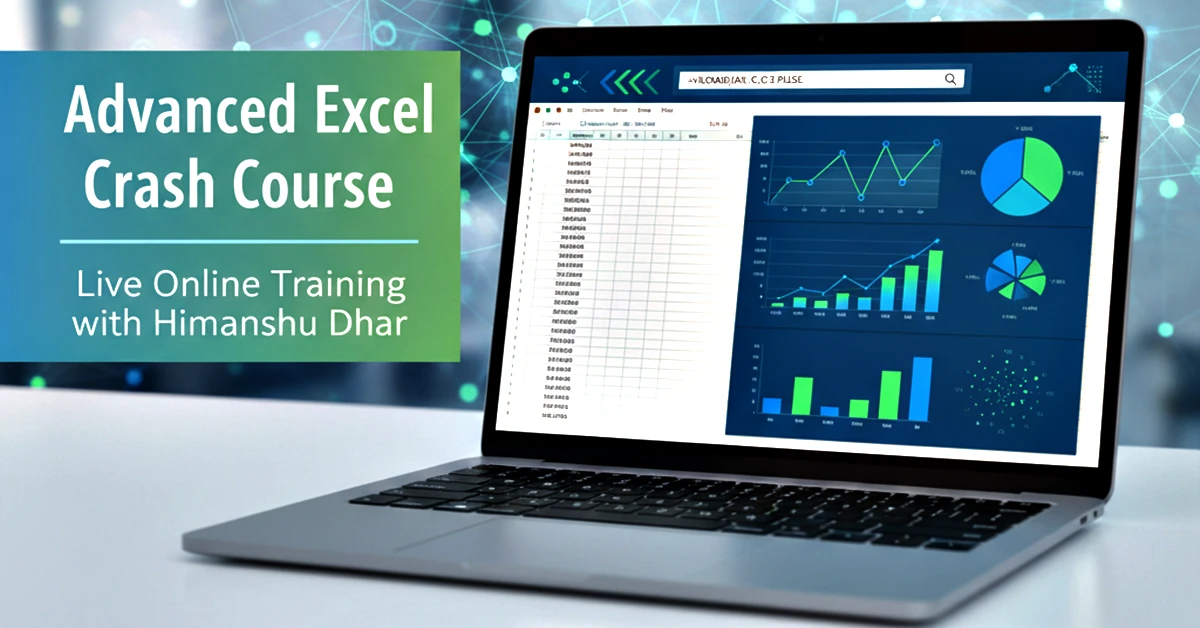
  • Master Advanced Excel in Just 10 Days – Online Live Training with Himanshu Dhar

    Master Advanced Excel in Just 10 Days – Online Live Training with Himanshu Dhar

    Unlock the power of Excel and transform the way you work with data! Whether you’re a professional looking to boost productivity, an analyst aiming for precision, or a manager wanting smarter reporting, our Advanced Excel Crash Course is designed for you.

    With live online classes, hands-on exercises, and real-world scenarios, you’ll learn how to use Excel like a pro in just 10 sessions.


    Course Highlights

    • Trainer: Himanshu Dhar – Experienced Excel Professional & Educator
    • Mode: Online Live Training – Attend from anywhere
    • Duration: 10 Hours (1 Hour per Day, 10 Days)
    • Certificate: Issued by I Turn Institute Pvt Ltd, a well-recognized authority
    • Doubt Clearance: Available for 6 months
    • Course Access Validity: 6 months

    Why This Course is Perfect for Professionals

    Excel is the backbone of modern business. From financial analysis to reporting, from dashboards to automation, Advanced Excel skills are essential. In this course, you’ll learn:

    • Advanced formulas: SUMIFS, COUNTIFS, AVERAGEIFS, IF, AND, OR, nested formulas, VLOOKUP, INDEX-MATCH, Array lookups
    • Data analysis & automation: Pivot Tables, Conditional Formatting, Data Validation, Dynamic Charts
    • Professional reporting: Sort, Filter, Custom Sort, Chart Preparation, Date & Time calculations
    • Security & flexibility: Protect sheets, hide formulas, allow editable ranges

    10-Day Course Structure

    DayTopicKey Takeaways
    Day 1Excel Structure & NavigationWorkbooks, Sheets, Ribbon customization, Autofill options
    Day 2Math FunctionsSUM, AVERAGE, COUNT, MAX, MIN, ROUND, LARGE, SMALL, SUMIF, COUNTIF, AVERAGEIF
    Day 3Conditional AggregationSUMIFS, COUNTIFS, AVERAGEIFS, Wildcards, Filter, Advanced Filter, Sort
    Day 4Conditional Formatting & ProtectionHighlight rules, protect sheets, hide formulas, allow editable ranges
    Day 5Logical FunctionsIF, Nested IF, AND, OR
    Day 6Lookup FunctionsVLOOKUP, IFERROR with VLOOKUP, Array VLOOKUP
    Day 7Advanced LookupINDEX & MATCH, Nested INDEX-MATCH, Lookup tricks, VLOOKUP TRUE
    Day 8Pivot TablesComplete pivot table functionality, calculated fields, grouping, slicers
    Day 9Chart PreparationColumn, Line, Pie, Combo charts, formatting, dynamic charts
    Day 10Data Validation & Date/TimeDrop-down lists, input restrictions, DATE, TIME, TODAY, NOW, NETWORKDAYS

    Fee & Special Discount

    • Original Fee: ₹3000
    • Special Discounted Fee: ₹2100

    Invest in yourself and gain skills that save hours of work every week!


    Why Choose This Course?

    1. Live Training: Get instant clarification on doubts from Himanshu Dhar, an expert trainer.
    2. Certificate: Showcase your skills with a recognized certificate from I Turn Institute Pvt Ltd.
    3. 6 Months Doubt Support: Ask questions anytime for up to 6 months after course completion.
    4. Practical Learning: Every session includes hands-on exercises with real-world datasets.
    5. Flexible Access: Course validity of 6 months, allowing learning at your own pace.

    About Your Trainer: Himanshu Dhar

    Learn from Himanshu Dhar, a dedicated MIS and Excel trainer with over 14 years of experience in data management and automation. Himanshu has trained more than 25,000 students across corporate and individual programs, focusing on practical Excel, Macros, and VBA skills that can be applied in real-world projects.

    Check his Udemy profile for courses, ratings, and student reviews: Himanshu Dhar on Udemy


    Who Should Enroll?

    • Professionals aiming to enhance Excel skills for business analysis
    • Managers preparing reports and dashboards
    • Students and job seekers who want to strengthen their Excel resume
    • Anyone wanting practical, advanced Excel skills to save time and improve productivity

    Enroll Now – Book Your Free Demo!

    Take the first step towards mastering Advanced Excel today!

    • Free 30-Minute Demo / Consultation: Book a session with Himanshu Dhar to experience the course before enrolling.
    • WhatsApp Enrollment & Enquiry: 📱 7827979099

    Fee after Discount: ₹2100

    Don’t miss this opportunity to enhance your career with Advanced Excel skills – all from the comfort of your home!



  • 1-Day Excel Interview Prep Plan: How to Master Key Skills Overnight

    If you have just one day to prepare for an Excel-related interview, your goal isn’t to learn everything — it’s to refresh the essentials, cover high-frequency questions, and get hands-on practice so you can answer with confidence.

    Here’s a step-by-step crash plan (8–10 hours total):


    ⏰ Hour 1: Understand the Job Role

    • Check the job description → Which Excel skills do they want? (e.g., data analysis, reporting, dashboards, VBA, Power Query).
    • Identify focus areas → If it says MIS, focus more on reporting formulas. If Data Analyst, focus more on lookup, filters, and pivot tables.
    • Quickly note down:
      • Core functions mentioned
      • Tools (Pivot Table, Power Query, Macros, SQL, etc.)
      • Business context (sales reports, financial data, etc.)

    ⏰ Hours 2–4: Formula Mastery

    Focus on 10–12 key formulas you will almost certainly be tested on:

    Formula / FunctionWhy ImportantQuick Example
    VLOOKUP / XLOOKUPMerge datasets, fetch related data=XLOOKUP(101, A2:A100, B2:B100, "Not Found")
    INDEX + MATCHFlexible lookups=INDEX(Sales, MATCH("Apple", Product, 0))
    IF + IFSConditional logic=IF(B2>5000,"High","Low")
    SUMIF / SUMIFSConditional totals=SUMIFS(Sales, Region, "East", Product, "Apple")
    COUNTIF / COUNTIFSCount with conditions=COUNTIFS(Region,"West", Sales, ">5000")
    TEXT functions (LEFT, RIGHT, MID, TRIM, LEN)Clean & extract text=LEFT(A2,5)
    FILTERDynamic filtering=FILTER(A2:D100, Region="North")
    UNIQUERemove duplicates=UNIQUE(Product)
    Date functions (YEAR, MONTH, EOMONTH, TEXT)Date-based analysis=TEXT(A2,"MMM-YYYY")

    Action:

    • Open Excel and type small practice datasets (10–15 rows).
    • Try each formula 3–4 times until you can do it without looking up syntax.

    ⏰ Hours 5–6: Pivot Tables & Data Cleaning

    • Create 2–3 quick Pivot Tables:
      • Sales by Region and Month
      • Top 5 products by revenue
    • Practice:
      • Sorting, filtering
      • Grouping dates
      • Adding calculated fields
    • In Power Query:
      • Remove duplicates
      • Split columns
      • Change data types
      • Merge two tables

    ⏰ Hours 7–8: Practice Real Problems

    • Download any sample dataset (e.g., sales data, HR data from Kaggle or random CSV).
    • Do these exercises:
      • Find top performer by sales
      • Monthly sales trend
      • Count customers who purchased more than 3 times
      • Merge customer table with orders table
      • Create a simple dashboard (Pivot + Slicer)

    ⏰ Hour 9: Review Common Interview Questions

    Technical Qs:

    1. Difference between VLOOKUP and INDEX+MATCH?
    2. How to remove duplicates without affecting original data?
    3. How do you handle missing data in Excel?
    4. How to extract month name from a date?
    5. What is the difference between Absolute and Relative cell references?

    Scenario Qs:

    1. “You have sales data; find the top 3 regions by revenue.”
    2. “Find customers who purchased in Jan but not in Feb.”
    3. “Your report shows wrong totals—how do you troubleshoot?”

    ⏰ Hour 10: Mock Drill

    • Set a 30-min timer.
    • Ask a friend (or yourself) to give you 5 tasks on a dataset.
    • Solve them without Google — this simulates test conditions.
    • After the drill, check your answers and note mistakes.

    💡 Last-Minute Tips for the Interview

    • Think out loud → Even if you don’t know the answer, walk through your approach.
    • Show shortcut keys (Ctrl+T for tables, Alt+N+V for Pivot Tables) — looks impressive.
    • Focus on accuracy first, speed later — wrong answers ruin trust.

  • Top 10 Excel Functions Every Data Analyst Must Master

    When Rohan, a 26-year-old commerce graduate from Pune, started preparing for his first data analyst interview, he quickly realized one thing – Excel is not just a spreadsheet tool, it’s a career-making skill.

    He had always used Excel for basic sums and formatting, but during mock interviews, he froze when asked,

    “Can you combine INDEX and MATCH to find a sales figure for a product in a given month?”

    That day, Rohan decided – No more guesswork. I will master the top Excel functions recruiters expect.
    Here’s what he learned, with examples from his practice sessions.


    1. VLOOKUP / XLOOKUP – Rohan’s ‘Data Detective’ Tool

    One day, Rohan had two datasets – one with Product Names, another with Sales Values.
    Instead of scrolling endlessly, he used:

    =XLOOKUP("Mango Juice", A2:A100, B2:B100, "Not Found")
    

    Result: Sales value for Mango Juice in seconds.
    Lesson: Lookup functions save hours in data matching.


    2. INDEX + MATCH – Rohan’s Upgrade

    During an interview test, the product name was in column C, and sales were in column A.
    VLOOKUP couldn’t help (it needs the lookup column first).
    Rohan used:

    =INDEX(A2:A100, MATCH("Mango Juice", C2:C100, 0))
    

    Lesson: INDEX+MATCH works in any direction and is interview gold.


    3. TEXT Functions – Cleaning Rohan’s Messy Data

    His dataset had customer IDs like " AB1234 " with spaces.
    He cleaned it using:

    =TRIM(A2)
    

    And extracted first 2 letters for state code:

    =LEFT(A2, 2)
    

    Lesson: TEXT functions like LEFT, RIGHT, MID, TRIM, and LEN are must-haves for messy datasets.


    4. IF + IFS – Decision Maker

    When given sales targets, Rohan categorized them:

    =IF(B2>=100000, "Top Performer", "Needs Improvement")
    

    For multiple conditions:

    =IFS(B2>=100000, "Top Performer", B2>=50000, "Average", TRUE, "Low")
    

    Lesson: IF helps classify data instantly.


    5. SUMIF / SUMIFS – Finding Patterns

    To know the total sales for “Mango Juice” in the “East” region:

    =SUMIFS(Sales, Product, "Mango Juice", Region, "East")
    

    Lesson: SUMIFS is perfect for quick conditional aggregations.


    6. COUNTIF / COUNTIFS – Counting What Matters

    In one dataset, Rohan needed to know how many orders were above ₹5,000:

    =COUNTIF(Sales, ">5000")
    

    Lesson: COUNT functions are quick ways to spot trends in large datasets.


    7. FILTER – Rohan’s Shortcut to Relevant Data

    Instead of applying Excel’s manual filter, Rohan extracted all sales for the “North” region with:

    =FILTER(A2:D100, Region="North")
    

    Lesson: Dynamic, criteria-based extraction beats manual filtering.


    8. UNIQUE – Finding Distinct Customers

    When asked for the number of unique buyers, Rohan did:

    =UNIQUE(CustomerName)
    

    Lesson: UNIQUE quickly deduplicates lists for better analysis.


    9. Date Functions – Time Travel in Excel

    Rohan needed monthly trends. He used:

    =TEXT(OrderDate, "MMM-YYYY")
    

    For month-end date:

    =EOMONTH(OrderDate, 0)
    

    Lesson: Date functions help slice and dice time-based data.


    10. Power Query + Power Pivot – Rohan’s Secret Weapon

    By now, Rohan could clean data in Power Query, load millions of rows, and use DAX for calculated measures.
    In one interview, he impressed the panel by transforming raw CSV files into a dashboard-ready table in 10 minutes.


    Rohan’s Takeaway

    “Excel isn’t about knowing formulas by heart—it’s about knowing which function to use when, and how to combine them.”

    Master these 10 functions, and you’re not just prepared for a data analyst job—you’re prepared for real-world problem solving.


    Top rated products