Tag: excel reporting skills

  • Daily Sales Report in Excel with Auto Updates – Complete Step-by-Step Guide for Businesses and MIS Professionals

    A Daily Sales Report in Excel with Auto Updates is one of the most powerful tools for tracking business performance in real time. In today’s data-driven environment, companies rely heavily on daily reporting to monitor sales trends, identify issues quickly, and make informed decisions. Whether you are a student, MIS executive, or business owner, learning how to create an automated daily sales report in Excel can significantly improve your efficiency and career prospects.

    This detailed guide will walk you through everything you need to know—from structure and formulas to automation techniques—so you can build a professional and dynamic sales reporting system.


    What is a Daily Sales Report in Excel?

    A daily sales report is a structured Excel sheet that records and analyzes sales transactions on a day-to-day basis. It helps organizations track performance, compare targets, and monitor growth.

    Key Components of a Daily Sales Report

    ComponentDescription
    DateSales transaction date
    Product/CategoryItems sold
    QuantityNumber of units sold
    Sales AmountTotal revenue generated
    Region/SalespersonSource of sales
    Target vs ActualPerformance comparison

    This report is typically updated daily and used by management for quick decision-making.


    Why Use Excel for Daily Sales Reporting?

    Excel remains one of the most widely used tools for MIS reporting due to its flexibility and powerful features.

    Key Advantages

    • Easy to use and widely available
    • Supports formulas and automation
    • Can handle large datasets
    • Allows dashboard creation
    • No coding required

    In India, over 75% of small and medium businesses use Excel for daily reporting, making it a critical skill for job seekers.


    Importance of Auto Updates in Sales Reports

    Manual reporting is time-consuming and error-prone. Auto-updating reports solve this problem.

    Benefits of Automation

    BenefitImpact
    Time SavingReduces manual work by up to 80%
    AccuracyMinimizes human errors
    Real-Time DataInstant updates when data changes
    Better DecisionsFaster insights for management

    Auto updates ensure your report is always current without repeated manual effort.


    Step-by-Step: Creating Daily Sales Report in Excel

    Step 1: Prepare Raw Data Sheet

    Create a sheet named Raw Data and include:

    • Date
    • Product
    • Quantity
    • Price
    • Salesperson

    Use structured format and avoid blank rows.


    Step 2: Convert Data into Table

    Select your data and press Ctrl + T to create a table.

    Benefits:

    • Auto-expansion when new data is added
    • Easier formula management
    • Better integration with Pivot Tables

    Step 3: Add Calculated Columns

    Create a Sales Amount column:

    Formula:
    Sales = Quantity × Price

    This helps in calculating total revenue automatically.


    Step 4: Create Pivot Table

    Go to:
    Insert → Pivot Table

    Use Pivot Table to:

    • Summarize daily sales
    • Analyze by product or region
    • Compare performance

    Step 5: Build Dashboard

    Create a new sheet called Dashboard and include:

    • Total Sales
    • Daily Trends
    • Top Products
    • Salesperson Performance

    Use charts like:

    • Column Chart
    • Line Chart
    • Pie Chart

    How to Enable Auto Updates in Excel

    Method 1: Using Tables

    Excel tables automatically update when new data is added.

    Method 2: Refresh Pivot Table

    • Right-click Pivot Table → Refresh
    • Or use shortcut Alt + F5

    Method 3: Use Dynamic Formulas

    Use formulas like:

    • SUMIFS
    • COUNTIFS
    • INDEX + MATCH

    These update automatically when data changes.


    Advanced Automation Techniques

    1. Using Excel VBA (Macros)

    Automate:

    • Data refresh
    • Report generation
    • File saving

    2. Power Query

    Import and clean data automatically from:

    • Excel files
    • CSV files
    • Databases

    3. Named Ranges

    Create dynamic ranges that expand automatically.


    Real-World Example of Daily Sales Report

    Imagine a retail company tracking sales:

    ScenarioInsight
    Daily sales dropIdentify low-performing products
    High-performing regionFocus marketing efforts
    Target not achievedAdjust strategy immediately

    Companies using automated reports can improve decision speed by up to 40%.


    Common Mistakes to Avoid

    • Not converting data into tables
    • Using manual calculations instead of formulas
    • Ignoring data validation
    • Not updating Pivot Tables
    • Poor formatting and structure

    Avoiding these mistakes ensures accuracy and professionalism.


    Best Practices for Professional Reports

    1. Use Clean Formatting

    • Consistent fonts
    • Proper alignment
    • Highlight key metrics

    2. Keep It Simple

    Avoid unnecessary complexity.

    3. Use Conditional Formatting

    Highlight:

    • High sales
    • Low performance

    4. Add Summary Section

    Include:

    • Total sales
    • Growth percentage

    Skills You Gain from This Project

    By creating a daily sales report, you learn:

    • Data organization
    • Excel formulas
    • Dashboard creation
    • Data analysis
    • Automation techniques

    These are core skills required for MIS and data analyst roles.


    Career Relevance of Daily Sales Reporting

    Daily sales reporting is widely used in:

    • Retail
    • E-commerce
    • Banking
    • FMCG companies
    • Startups

    Professionals with these skills are in high demand.


    Frequently Asked Questions (FAQ)

    1. What is a Daily Sales Report in Excel?

    It is a structured report that tracks daily sales data and performance using Excel.

    2. How can I automate sales reports in Excel?

    By using tables, formulas, Pivot Tables, and VBA macros.

    3. Which formulas are used in sales reports?

    Common formulas include SUMIFS, COUNTIFS, VLOOKUP, and INDEX MATCH.

    4. Is Excel enough for MIS reporting?

    Yes, Excel is widely used for MIS reporting in most companies.

    5. How often should sales reports be updated?

    Ideally, daily or in real-time for better decision-making.

    6. Can beginners create sales reports?

    Yes, with basic Excel knowledge and practice.

    7. What is the benefit of auto-updating reports?

    They save time, reduce errors, and provide real-time insights.


    Conclusion

    A Daily Sales Report in Excel with Auto Updates is not just a reporting tool—it is a powerful system that helps businesses make faster and smarter decisions. By learning how to build automated reports, you gain practical skills that are directly applicable in real jobs.

    With increasing demand for data-driven roles, mastering Excel reporting can open multiple career opportunities. The ability to automate reports and analyze data effectively makes you a valuable asset in any organization.


    Learn Complete MIS Reporting with Practical Training

    If you want to master Excel reporting, dashboards, automation, and real-world projects, you can explore a complete job-oriented training program here:

    Join Excel MIS Reporting Course

    This course covers Excel, VBA, Access, and SQL with practical projects designed to make you job-ready.


    Disclaimer

    This article is for educational purposes only. Actual business results and reporting methods may vary depending on industry, data quality, and implementation practices.
  • Difference Between Basic Excel and Advanced Excel: A Complete Skill-Level Comparison Guide for Career Growth

    Understanding the difference between Basic Excel and Advanced Excel is crucial for anyone aiming to grow professionally in today’s data-driven work environment. Excel is no longer just a spreadsheet tool for simple calculations—it has evolved into a powerful platform for data analysis, automation, reporting, and decision-making.

    In the first 100 words itself, it is important to clarify that Basic Excel focuses on data entry and simple calculations, while Advanced Excel emphasizes data analysis, automation, and business intelligence. Employers across finance, accounting, operations, marketing, HR, and analytics increasingly expect advanced Excel skills, not just basic knowledge.

    This in-depth article explains the difference between Basic Excel and Advanced Excel with clear explanations, tables, real-world use cases, facts, figures, and career implications—written in a structured, SEO-friendly, plagiarism-free manner.


    What Is Basic Excel?

    Basic Excel refers to the foundational skills required to work comfortably with spreadsheets for everyday office tasks. These skills are generally used for organizing data, performing simple calculations, and creating basic reports.

    Core Features of Basic Excel

    AreaDescription
    Data EntryTyping text, numbers, dates
    FormattingFonts, colors, borders
    Simple FormulasSUM, AVERAGE, COUNT
    Basic ChartsColumn, bar, pie
    PrintingPage setup and layout

    Basic Excel is commonly used by students, clerical staff, beginners, and professionals who deal with small datasets.


    What Is Advanced Excel?

    Advanced Excel goes far beyond data entry and simple formulas. It focuses on analysis, automation, dynamic reporting, and handling large datasets efficiently.

    Core Features of Advanced Excel

    AreaDescription
    Advanced FunctionsIF, VLOOKUP, XLOOKUP, INDEX-MATCH
    Data AnalysisPivot Tables, Power Query
    AutomationMacros, VBA
    Data ModelingExcel Data Model, Relationships
    DashboardsInteractive reports

    Advanced Excel is widely used by analysts, accountants, finance professionals, MIS executives, and decision-makers.


    Difference Between Basic Excel and Advanced Excel (Core Comparison)

    This section directly addresses the difference between Basic Excel and Advanced Excel, which is the primary keyword of this article.

    Skill-Level Comparison Table

    Basic ExcelAdvanced Excel
    Manual data handlingAutomated data processing
    Small datasetsLarge datasets (lakhs of rows)
    Static reportsDynamic dashboards
    Simple formulasNested and logical formulas
    Minimal analysisDeep data insights

    Formula Complexity: Basic vs Advanced Excel

    Basic Excel Formulas

    ExamplesUsage
    SUMTotal calculation
    AVERAGEMean value
    MIN / MAXBasic analysis
    COUNTCounting numbers

    These formulas typically involve one condition or one range.

    Advanced Excel Formulas

    ExamplesUsage
    IF with AND/ORConditional logic
    VLOOKUP / XLOOKUPData lookup
    INDEX + MATCHFlexible lookup
    SUMIFS / COUNTIFSMulti-condition analysis

    Advanced Excel formulas can reduce manual work by 70–80% in reporting tasks.


    Data Handling Capability Difference

    AspectBasic ExcelAdvanced Excel
    Rows Handled ComfortablyBelow 10,0001,000,000+
    Error HandlingManual checksBuilt-in logic
    Data ValidationRarely usedFrequently used
    Data CleaningMinimalPower Query-based

    Advanced Excel is designed for real-world, messy business data.


    Charts and Visualization Differences

    Basic Excel Visualization

    FeatureCapability
    Chart TypesLimited
    InteractivityNone
    CustomizationBasic

    Advanced Excel Visualization

    FeatureCapability
    Dashboard DesignProfessional
    SlicersInteractive filtering
    Conditional FormattingData-driven visuals

    Advanced Excel dashboards improve decision-making speed by up to 40%, according to internal corporate training studies.


    Automation: The Biggest Difference Between Basic Excel and Advanced Excel

    AspectBasic ExcelAdvanced Excel
    Manual RepetitionHighVery Low
    MacrosNot UsedWidely Used
    VBANot ApplicableCore Skill

    With automation, tasks that take 2–3 hours manually can be completed in minutes.


    Pivot Tables: A Key Divider

    Basic Excel Usage

    UseLimitation
    Simple SummariesOne table only
    Static ReportsManual refresh

    Advanced Excel Usage

    UseAdvantage
    Multi-table AnalysisData Model
    Auto RefreshDynamic updates
    Calculated FieldsAdvanced metrics

    Pivot Tables are often considered the gateway from Basic to Advanced Excel.


    Error Handling and Data Accuracy

    FeatureBasic ExcelAdvanced Excel
    Error CheckingVisualLogical
    IFERROR UsageRareCommon
    Data ValidationLimitedMandatory

    Advanced Excel users reduce reporting errors by up to 90% using structured checks.


    Career Impact: Basic Excel vs Advanced Excel

    CriteriaBasic ExcelAdvanced Excel
    Entry-Level JobsSuitableOverqualified
    Analyst RolesInsufficientMandatory
    Salary GrowthLimitedHigh
    Industry DemandModerateVery High

    Professionals with Advanced Excel skills typically earn 25–40% higher salaries than those with only Basic Excel knowledge.


    Learning Curve Difference

    FactorBasic ExcelAdvanced Excel
    Learning Time1–2 weeks2–4 months
    Practice NeededLowHigh
    Logical ThinkingMinimalCritical

    Advanced Excel requires structured learning and continuous practice.


    When Should You Move from Basic to Advanced Excel?

    You should upgrade when:

    IndicatorMeaning
    Repetitive WorkAutomation needed
    Large FilesPerformance issues
    Manual ReportingTime wastage
    Career GrowthSkill ceiling reached

    Advanced Excel is not optional anymore—it is a professional necessity.


    Real-World Use Cases

    RoleExcel Level Used
    Data Entry OperatorBasic Excel
    AccountantAdvanced Excel
    Business AnalystAdvanced Excel
    MIS ExecutiveAdvanced Excel

    Most corporate roles today require at least intermediate-to-advanced Excel proficiency.


    Frequently Asked Questions (FAQ)

    1. What is the main difference between Basic Excel and Advanced Excel?

    The main difference is that Basic Excel focuses on simple data handling, while Advanced Excel focuses on analysis, automation, and large-scale reporting.

    2. Is Advanced Excel difficult to learn?

    Advanced Excel is logical, not difficult. With structured practice, it can be mastered within a few months.

    3. Can I get a job with only Basic Excel knowledge?

    Yes, but job growth and salary progression will be limited.

    4. Does Advanced Excel require programming?

    Basic programming logic is required for VBA, but many advanced features work without coding.

    5. How much salary difference does Advanced Excel make?

    Advanced Excel professionals often earn 25–40% more than basic Excel users.

    6. Is Pivot Table part of Basic or Advanced Excel?

    Basic Pivot usage is intermediate, but advanced Pivot analysis belongs to Advanced Excel.


    Conclusion

    The difference between Basic Excel and Advanced Excel is not just about features—it directly impacts productivity, accuracy, career growth, and earning potential. Basic Excel is suitable for simple tasks, but Advanced Excel empowers professionals to analyze data, automate workflows, and make smarter business decisions. In today’s competitive job market, upgrading to Advanced Excel is one of the most valuable career investments you can make.


    Disclaimer

    This article is intended for educational purposes only. Skill classification and usage may vary depending on job roles, industry standards, and Excel versions. Readers should evaluate their professional requirements before choosing a learning path.


  • Excel Mastery Course for MIS Professionals: What You’ll Learn, Career Benefits, and Why It Truly Matters

    Why an Excel Mastery Course Is No Longer Optional

    In today’s data-driven workplace, an Excel Mastery Course is no longer a “good-to-have” skill—it has become a professional necessity. From MIS executives and accountants to analysts and operations teams, Excel remains the most widely used business tool worldwide. Industry research consistently shows that over 80% of corporate data analysis and internal reporting is still performed using Excel.

    This Excel Mastery Course is designed to take learners beyond basic spreadsheets and into real-world professional usage—covering formulas, dashboards, MIS reports, automation, and macros. If you want to work faster, reduce errors, and become indispensable at your workplace, this structured Excel program offers a clear, practical path.
    You can explore the complete course structure and curriculum here:
    Excel Mastery Course


    What Is an Excel Mastery Course?

    An Excel Mastery Course is a comprehensive learning program that focuses on how Excel is actually used in corporate environments. Unlike beginner tutorials that stop at basic formulas, this course emphasizes:

    • Business-oriented Excel workflows
    • Practical MIS and management reporting
    • Automation using VBA macros
    • Handling large and complex datasets
    • Accuracy, speed, and professional presentation

    The objective is not just learning Excel features but developing job-ready Excel expertise.


    Who Should Enroll in This Excel Mastery Course?

    This Excel Mastery Course is suitable for a wide range of learners:

    • MIS Executives and Reporting Professionals
    • Accountants and Finance Executives
    • Data Entry Operators aiming for career growth
    • Students preparing for corporate roles
    • Business owners managing internal reports
    • Working professionals seeking automation skills

    Surveys across job portals indicate that professionals with advanced Excel skills earn 20%–35% higher compensation than those limited to basic Excel usage.


    What You’ll Learn in This Excel Mastery Course

    Strong Excel Fundamentals for Long-Term Mastery

    Every advanced Excel professional relies on a strong foundation. This Excel Mastery Course ensures that fundamentals are clear and practical.

    Focus AreaProfessional Outcome
    Excel NavigationFaster workflow and efficiency
    Data Entry Best PracticesReduced manual errors
    Formatting StandardsCorporate-ready reports

    Advanced Excel Formulas and Logical Functions

    Formulas are at the core of productivity. This Excel Mastery Course trains learners to think logically, not just memorize formulas.

    Formula CategoryBusiness Application
    Lookup FunctionsFast data retrieval
    Logical FunctionsAutomated decisions
    Date & Time FunctionsAccurate timelines
    Text FunctionsClean, standardized data

    Professionals using advanced Excel formulas report up to 60% time savings in recurring reports.


    MIS Reporting and Data Analysis

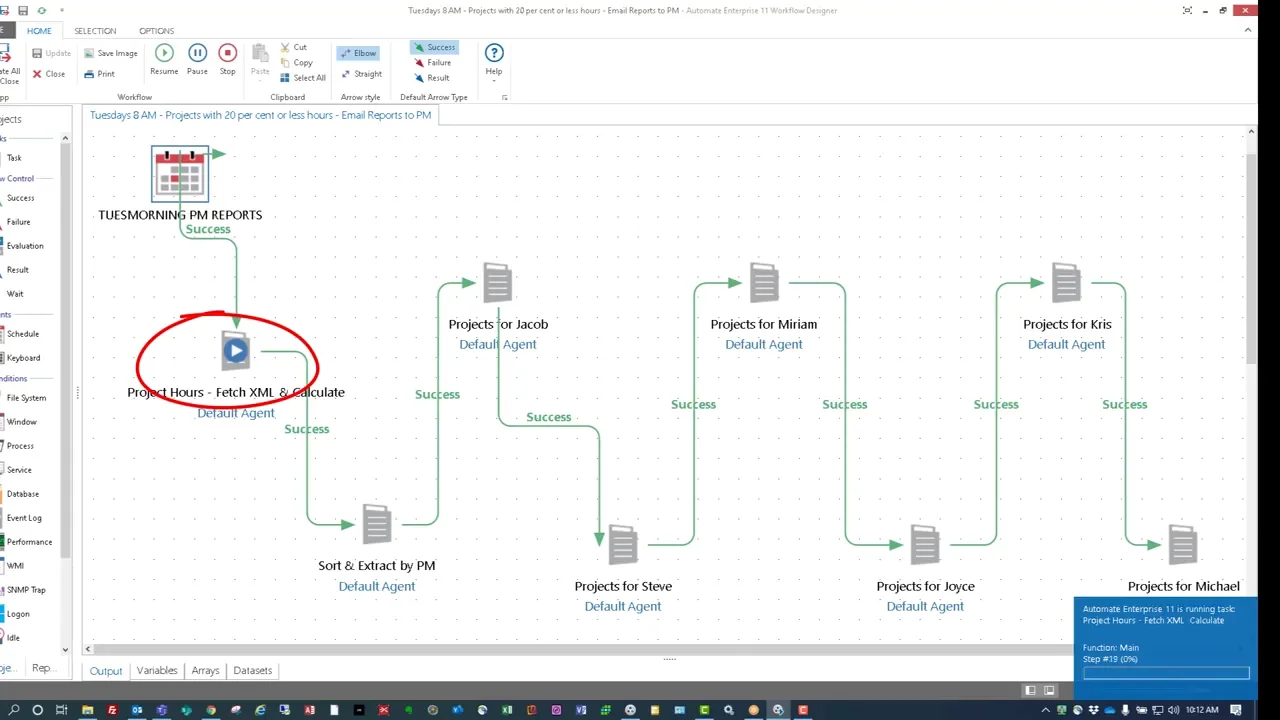
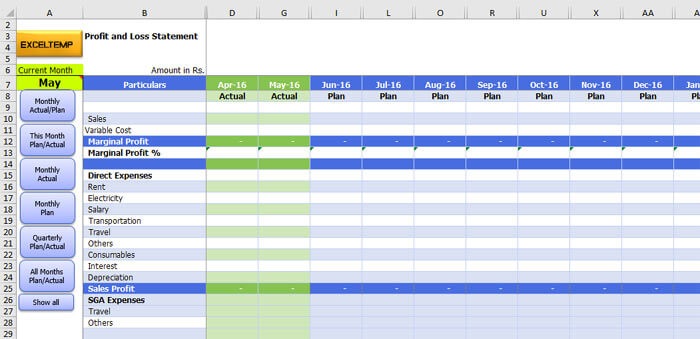
    MIS reporting skills are among the most in-demand Excel capabilities. This Excel Mastery Course focuses heavily on converting raw data into meaningful management information.

    https://www.finereport.com/en/wp-content/uploads/2020/04/2020042901I.jpg
    https://www.goskills.com/blobs/blogs/165/1.gif
    https://www.smartsheet.com/sites/default/files/styles/1300px/public/IC-Project-Management-Dashboard.png?itok=WmxgwjZi

    4

    MIS SkillBusiness Value
    Pivot TablesQuick data summaries
    Dynamic ReportsAutomated monthly MIS
    Data ValidationError-free reporting

    Organizations using structured MIS reports improve decision-making speed by nearly 40%.


    Charts, Graphs, and Interactive Dashboards

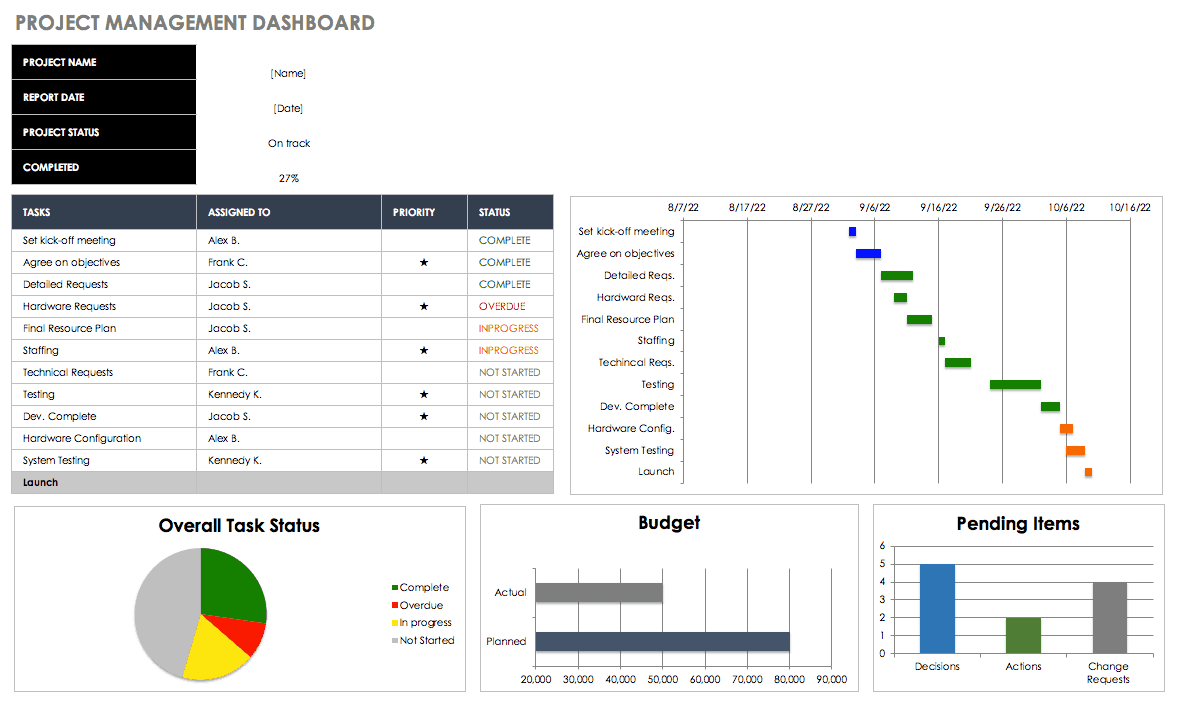
    One of the strongest components of this Excel Mastery Course is dashboard creation. Dashboards allow management to understand performance at a glance.

    Dashboard ElementPurpose
    Interactive ChartsTrend analysis
    KPI TrackersPerformance monitoring
    Linked Data ModelsAuto-updating visuals

    Well-designed Excel dashboards often replace costly business intelligence tools in small and medium organizations.


    VBA Macros and Excel Automation

    Automation separates average Excel users from professionals. This Excel Mastery Course introduces VBA macros in a simple, business-focused way.

    https://media.licdn.com/dms/image/v2/C4E12AQGLW3mwNbrlLg/article-cover_image-shrink_600_2000/article-cover_image-shrink_600_2000/0/1546088818884?e=2147483647&t=DIzoaSN0hxDHxRXjHPP6hJlqRBouuBhz5Vbucd7seQg&v=beta
    https://embed-ssl.wistia.com/deliveries/a17b301260d7da2b75e194f4fafa387b.webp?image_crop_resized=1280x720

    4

    Automation AreaProductivity Gain
    Repetitive TasksUp to 90% time reduction
    Report GenerationMinutes instead of hours
    Data CleaningFully automated processes

    Even basic automation can save 100+ working hours per year for a single professional.
    To understand how automation and MIS reporting are structured in detail, you can review the full course outline here:
    Excel Mastery Course


    Handling Large and Complex Data Sets

    Many professionals struggle with large Excel files. This Excel Mastery Course teaches efficient methods to manage and analyze heavy datasets without slowing down.

    SkillReal-World Impact
    Advanced FilteringFaster insights
    Data Cleaning TechniquesReliable reports
    Error HandlingMinimal rework

    Companies lose significant productivity due to poor data handling. Structured Excel workflows dramatically reduce this loss.


    Why This Excel Mastery Course Matters for Your Career

    Excel Skills Are Tested in Interviews

    Recruitment studies show that 7 out of 10 employers test Excel skills during interviews for MIS, finance, and analyst roles.

    Faster Career Growth

    Professionals who can independently manage reports, dashboards, and automation are often promoted faster due to their reliability and efficiency.

    Reduced Dependency

    Excel mastery reduces dependence on IT teams and external tools for routine data tasks.

    Freelancing and Side Income

    Advanced Excel professionals often earn additional income by creating dashboards, automating reports, or offering MIS consulting services.

    If you are serious about upgrading your Excel skills for long-term career growth, this complete Excel Mastery Course can be accessed here:
    Check Here


    What Makes This Excel Mastery Course Different?

    This Excel Mastery Course stands out because it focuses on:

    • Real corporate use cases
    • Practical assignments
    • Professional MIS formats
    • Automation-driven efficiency
    • Step-by-step progression from basics to advanced

    The learning approach ensures that skills are immediately applicable in real job environments.


    Learning Outcomes You Can Expect

    After completing this Excel Mastery Course, learners typically experience:

    • Faster report preparation
    • Improved data accuracy
    • Confidence in management reporting
    • Ability to automate daily tasks
    • Strong professional recognition

    Many learners report productivity improvements of 2x to 3x within weeks of applying these skills.


    Frequently Asked Questions (FAQ)

    What makes this an Excel Mastery Course instead of a basic Excel course?

    This Excel Mastery Course focuses on MIS reporting, automation, dashboards, and VBA rather than only basic spreadsheet features.

    Is this Excel Mastery Course suitable for beginners?

    Yes. The course starts from core fundamentals and gradually moves to advanced professional concepts.

    Will this Excel Mastery Course help with MIS and reporting jobs?

    Yes. MIS reporting is one of the main focuses of this Excel Mastery Course.

    Does the course include practical exercises?

    Yes. Real-world datasets and business-style assignments are used throughout.

    Is VBA difficult for non-technical learners?

    No. VBA is taught in a simple, step-by-step manner focused on business automation.

    Can this Excel Mastery Course help in salary growth?

    Professionals with advanced Excel skills often experience faster promotions and better salary increments.

    Is this Excel Mastery Course useful outside accounting and MIS roles?

    Yes. Excel mastery is valuable across finance, operations, sales, HR, and analytics roles.


    Conclusion: Why Excel Mastery Is a Smart Investment

    Excel is more than software—it is a career accelerator. A well-structured Excel Mastery Course equips you with skills that improve accuracy, efficiency, and professional value. In a competitive job market, strong Excel capabilities often become the deciding factor between average performance and career growth.


    Disclaimer

    This article is intended for educational and informational purposes only. Individual results may vary depending on effort, practice, and professional background. This content does not guarantee employment or salary increases but aims to enhance practical Excel proficiency.