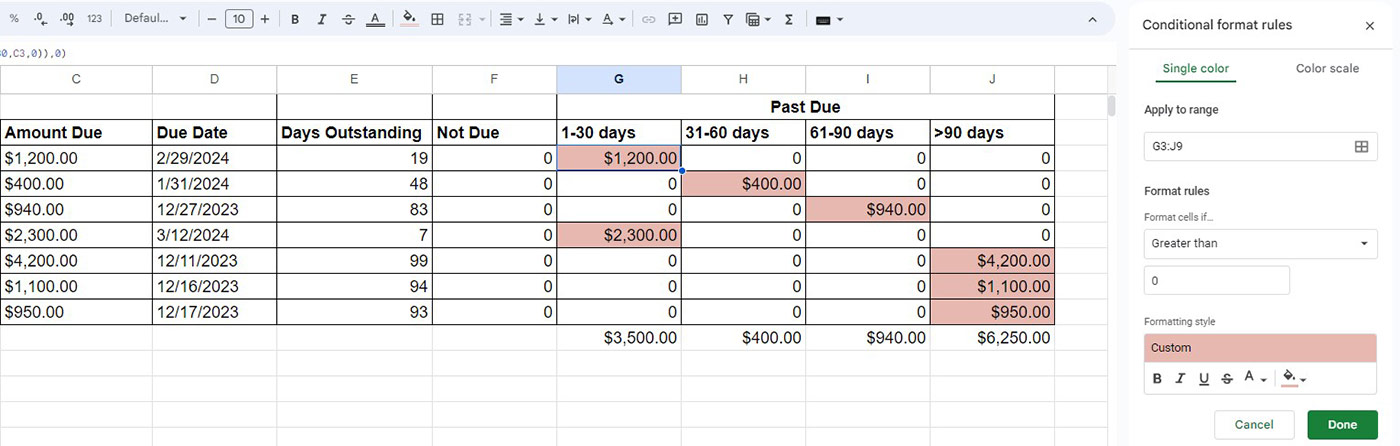
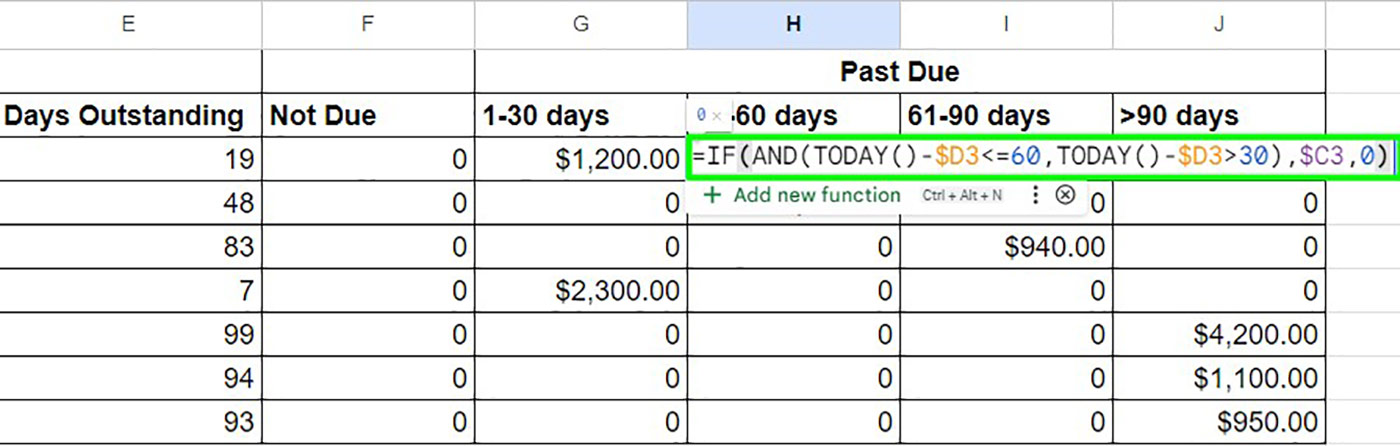
A Budget vs Actual Analysis Template is one of the most important financial management tools used by businesses, accountants, and MIS professionals. This template compares planned financial figures (budget) with real financial performance (actual results). By using a Budget vs Actual Analysis Template, organizations can easily identify overspending, revenue gaps, and operational inefficiencies.
Budget monitoring has become essential for both small businesses and large enterprises. According to financial planning studies, organizations that track budgets regularly improve financial control by nearly 25–35 percent compared to businesses that rely only on periodic financial reports.
In this comprehensive guide, you will learn how a Budget vs Actual Analysis Template works, why it is important, how to create one in Excel, and how businesses use it to improve financial planning and decision-making.
What is Budget vs Actual Analysis?
Budget vs Actual Analysis is the process of comparing planned financial targets with real financial outcomes. The comparison helps businesses understand whether they are meeting their financial expectations.
The analysis identifies the variance, which is the difference between budgeted and actual values.
Key Elements of Budget Analysis
| Element | Description |
|---|---|
| Budget | Planned financial estimate for a period |
| Actual | Real financial performance recorded |
| Variance | Difference between budget and actual |
| Variance Percentage | Percentage difference for better analysis |
| Financial Insight | Explanation of why differences occur |
Organizations typically perform budget analysis monthly, quarterly, or annually.
Why Businesses Use a Budget vs Actual Analysis Template
Financial planning requires continuous monitoring. A structured template makes the process faster and more accurate.
Key Advantages
| Advantage | Explanation |
|---|---|
| Financial Control | Prevents overspending |
| Performance Tracking | Measures departmental performance |
| Better Decision Making | Helps adjust budgets quickly |
| Transparency | Improves accountability across teams |
| Forecasting | Supports future financial planning |
Companies that actively monitor budgets often experience higher profitability and better cost management.
Understanding the Budget vs Actual Analysis Template
A typical template includes several financial fields that help compare expected and actual performance.
Common Data Fields in the Template
| Field | Purpose |
|---|---|
| Department | Area of business spending |
| Budget Amount | Planned financial allocation |
| Actual Amount | Real expenditure or revenue |
| Variance Amount | Difference between budget and actual |
| Variance Percentage | Percentage difference |
| Remarks | Explanation for the variance |
These fields allow managers to evaluate financial performance quickly.
Example Structure of a Budget vs Actual Analysis Template
The template is typically organized by departments or expense categories.
Sample Layout
| Column Name | Description |
|---|---|
| Category | Expense or revenue type |
| Budget | Planned financial amount |
| Actual | Real financial amount |
| Variance | Difference between budget and actual |
| Variance % | Percentage difference |
| Comments | Explanation of financial change |
This structure provides a clear financial overview for management.
How Variance is Calculated
Variance helps measure financial deviation.
Variance Formula
Variance = Actual Amount – Budget Amount
Positive variance means higher spending or higher revenue, while negative variance means lower spending or underperformance.
Variance Percentage Formula
Variance % = (Variance / Budget) × 100
This percentage helps businesses measure the scale of deviation.
Step-by-Step Guide to Creating a Budget vs Actual Analysis Template in Excel
Excel is one of the most popular tools for financial analysis because it provides flexibility and powerful calculation capabilities.
Step 1: Create the Data Structure
Begin by creating column headings.
| Column | Purpose |
|---|---|
| Category | Department or expense type |
| Budget | Planned spending |
| Actual | Real spending |
| Variance | Budget vs actual difference |
| Variance % | Percentage change |
| Comments | Reason for variance |
This structure forms the foundation of the analysis template.
Step 2: Enter Budget Data
Budget data is usually prepared before the financial period begins.
Examples include:
- Marketing budget
- Operational expenses
- Salaries
- Office utilities
- Travel expenses
Companies often allocate 10–30 percent of revenue toward operational costs, depending on the industry.
Step 3: Record Actual Financial Data
Actual data comes from accounting records such as:
- Accounting software reports
- Bank statements
- Expense records
- Revenue transactions
This data should be updated regularly to maintain accuracy.
Step 4: Calculate Variance
After entering budget and actual figures, calculate the variance.
Variance analysis quickly reveals:
- Overspending areas
- Underutilized budgets
- Revenue shortfalls
For example, if the marketing budget was ₹200,000 but actual spending was ₹250,000, the variance is ₹50,000 overspending.
Step 5: Calculate Variance Percentage
Variance percentage provides deeper insights.
Example calculation:
Budget = ₹200,000
Actual = ₹250,000
Variance = ₹50,000
Variance % = 25%
This indicates that spending exceeded the budget by 25 percent.
Step 6: Add Conditional Formatting
Conditional formatting improves visual interpretation.
Examples include:
- Red color for overspending
- Green color for savings
- Yellow color for moderate variance
Visual indicators make financial reports easier to understand.
Departments Commonly Included in Budget Analysis
Different organizations track budgets for multiple departments.
Typical Departments
| Department | Budget Area |
|---|---|
| Marketing | Advertising and promotions |
| Operations | Production and logistics |
| HR | Recruitment and employee benefits |
| IT | Technology and software |
| Administration | Office expenses |
Tracking budgets across departments helps maintain organizational discipline.
Real-World Business Applications
Budget vs Actual analysis is widely used across industries.
Corporate Finance
Finance teams use this analysis to monitor operational expenses and revenue growth.
Small Business Management
Small business owners track spending to maintain profitability.
Project Management
Project managers compare project budgets with actual spending.
Government and Public Sector
Government agencies track budget allocations to ensure transparency.
Nonprofit Organizations
Nonprofits monitor donations and operational expenses.
These applications show why budget analysis is critical for financial stability.
Common Budget Categories in Organizations
Most businesses categorize budgets into several groups.
Expense Categories
| Category | Description |
|---|---|
| Salaries | Employee compensation |
| Rent | Office or facility expenses |
| Utilities | Electricity, internet, water |
| Marketing | Advertising campaigns |
| Travel | Business travel expenses |
Monitoring these categories prevents financial mismanagement.
Best Practices for Budget vs Actual Analysis
Update Data Regularly
Monthly updates ensure accurate financial insights.
Analyze Variance Causes
Identify the reasons behind overspending or revenue gaps.
Use Graphical Dashboards
Charts and dashboards help managers visualize trends quickly.
Set Realistic Budgets
Budgets should reflect realistic business conditions.
Monitor Key Performance Indicators
Link budget analysis with KPIs such as profit margin and operating cost ratio.
Budget vs Actual Analysis for Financial Forecasting
Budget monitoring also supports future planning.
When businesses review past variances, they can improve future budgets by:
- Adjusting spending patterns
- Improving revenue projections
- Identifying cost-saving opportunities
Companies that review financial performance regularly often achieve higher financial stability and growth.
Benefits of Using Excel for Budget Analysis
Excel remains one of the most widely used tools for financial management.
Key Advantages
| Feature | Benefit |
|---|---|
| Formulas | Automatic calculations |
| Pivot Tables | Advanced financial summaries |
| Charts | Visual representation of data |
| Conditional Formatting | Highlights financial risks |
| Automation | Reduces manual errors |
Excel’s flexibility makes it suitable for both small businesses and large enterprises.
Frequently Asked Questions (FAQ)
What is a Budget vs Actual Analysis Template?
A Budget vs Actual Analysis Template is a structured financial worksheet that compares planned financial budgets with actual financial performance.
Why is budget vs actual analysis important?
It helps businesses identify overspending, control costs, and improve financial decision-making.
How often should budget analysis be performed?
Most organizations conduct budget analysis monthly or quarterly to monitor financial performance.
What is variance in budget analysis?
Variance is the difference between the budgeted amount and the actual amount.
Can Excel automate budget analysis?
Yes. Excel formulas and conditional formatting can automate calculations and highlight financial deviations.
Who uses budget vs actual templates?
Accountants, finance managers, business owners, project managers, and MIS professionals frequently use these templates.
What is a good variance percentage?
In many organizations, a variance within 5–10 percent is considered acceptable, depending on industry conditions.
Conclusion
A well-designed Budget vs Actual Analysis Template is a powerful financial management tool that helps organizations track performance, control spending, and improve profitability. By comparing planned budgets with real financial outcomes, businesses gain valuable insights into their operational efficiency.
Using Excel for budget analysis enables organizations to automate calculations, visualize trends, and generate meaningful financial reports. Whether used by small businesses or large enterprises, this analysis supports smarter financial planning and long-term growth.
Regular monitoring of budgets ensures that organizations stay financially disciplined and can quickly adjust strategies when financial performance deviates from expectations.
Disclaimer
This article is intended for educational and informational purposes only. Financial practices and budgeting methods may vary depending on industry standards, organizational policies, and accounting regulations. Readers should verify financial strategies according to their business requirements before implementing them.