Tag: excel dashboard course

  • Excel Mastery Course for MIS Professionals: What You’ll Learn, Career Benefits, and Why It Truly Matters

    Why an Excel Mastery Course Is No Longer Optional

    In today’s data-driven workplace, an Excel Mastery Course is no longer a “good-to-have” skill—it has become a professional necessity. From MIS executives and accountants to analysts and operations teams, Excel remains the most widely used business tool worldwide. Industry research consistently shows that over 80% of corporate data analysis and internal reporting is still performed using Excel.

    This Excel Mastery Course is designed to take learners beyond basic spreadsheets and into real-world professional usage—covering formulas, dashboards, MIS reports, automation, and macros. If you want to work faster, reduce errors, and become indispensable at your workplace, this structured Excel program offers a clear, practical path.
    You can explore the complete course structure and curriculum here:
    Excel Mastery Course


    What Is an Excel Mastery Course?

    An Excel Mastery Course is a comprehensive learning program that focuses on how Excel is actually used in corporate environments. Unlike beginner tutorials that stop at basic formulas, this course emphasizes:

    • Business-oriented Excel workflows
    • Practical MIS and management reporting
    • Automation using VBA macros
    • Handling large and complex datasets
    • Accuracy, speed, and professional presentation

    The objective is not just learning Excel features but developing job-ready Excel expertise.


    Who Should Enroll in This Excel Mastery Course?

    This Excel Mastery Course is suitable for a wide range of learners:

    • MIS Executives and Reporting Professionals
    • Accountants and Finance Executives
    • Data Entry Operators aiming for career growth
    • Students preparing for corporate roles
    • Business owners managing internal reports
    • Working professionals seeking automation skills

    Surveys across job portals indicate that professionals with advanced Excel skills earn 20%–35% higher compensation than those limited to basic Excel usage.


    What You’ll Learn in This Excel Mastery Course

    Strong Excel Fundamentals for Long-Term Mastery

    Every advanced Excel professional relies on a strong foundation. This Excel Mastery Course ensures that fundamentals are clear and practical.

    Focus AreaProfessional Outcome
    Excel NavigationFaster workflow and efficiency
    Data Entry Best PracticesReduced manual errors
    Formatting StandardsCorporate-ready reports

    Advanced Excel Formulas and Logical Functions

    Formulas are at the core of productivity. This Excel Mastery Course trains learners to think logically, not just memorize formulas.

    Formula CategoryBusiness Application
    Lookup FunctionsFast data retrieval
    Logical FunctionsAutomated decisions
    Date & Time FunctionsAccurate timelines
    Text FunctionsClean, standardized data

    Professionals using advanced Excel formulas report up to 60% time savings in recurring reports.


    MIS Reporting and Data Analysis

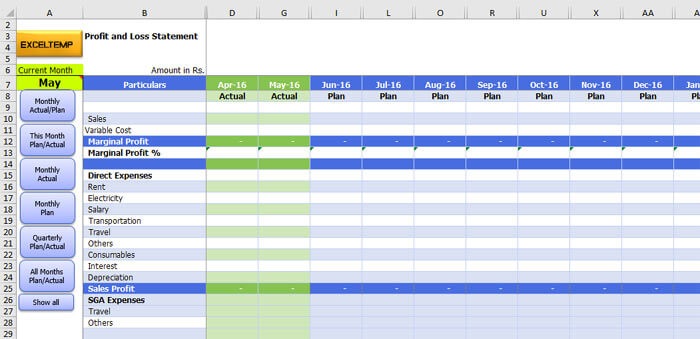
    MIS reporting skills are among the most in-demand Excel capabilities. This Excel Mastery Course focuses heavily on converting raw data into meaningful management information.
    https://www.finereport.com/en/wp-content/uploads/2020/04/2020042901I.jpg
    https://www.goskills.com/blobs/blogs/165/1.gif
    https://www.smartsheet.com/sites/default/files/styles/1300px/public/IC-Project-Management-Dashboard.png?itok=WmxgwjZi

    4

    MIS SkillBusiness Value
    Pivot TablesQuick data summaries
    Dynamic ReportsAutomated monthly MIS
    Data ValidationError-free reporting

    Organizations using structured MIS reports improve decision-making speed by nearly 40%.


    Charts, Graphs, and Interactive Dashboards

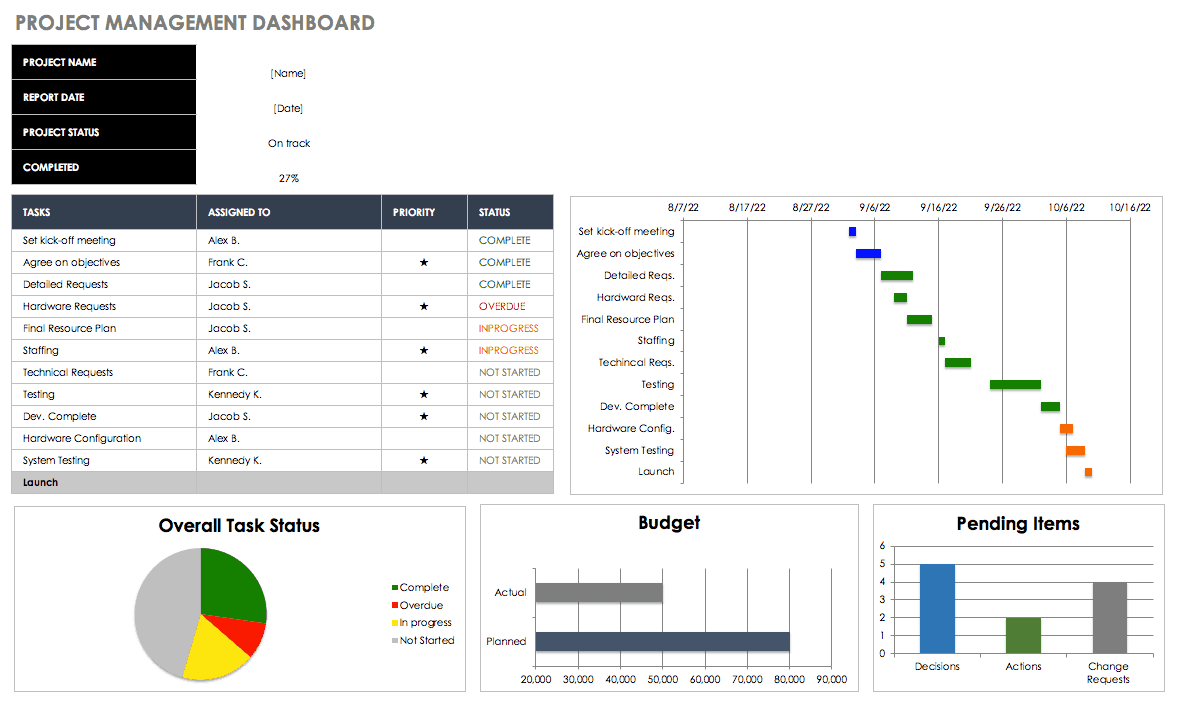
    One of the strongest components of this Excel Mastery Course is dashboard creation. Dashboards allow management to understand performance at a glance.

    Dashboard ElementPurpose
    Interactive ChartsTrend analysis
    KPI TrackersPerformance monitoring
    Linked Data ModelsAuto-updating visuals

    Well-designed Excel dashboards often replace costly business intelligence tools in small and medium organizations.


    VBA Macros and Excel Automation

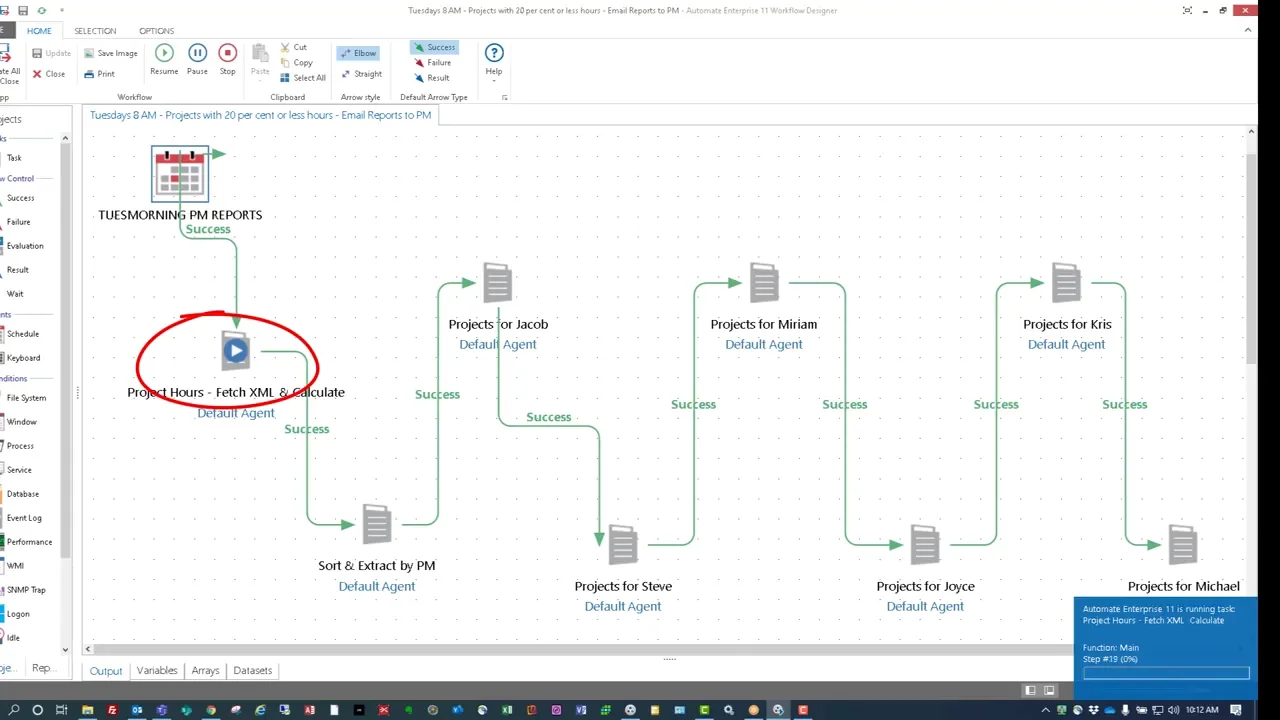
    Automation separates average Excel users from professionals. This Excel Mastery Course introduces VBA macros in a simple, business-focused way.

    https://media.licdn.com/dms/image/v2/C4E12AQGLW3mwNbrlLg/article-cover_image-shrink_600_2000/article-cover_image-shrink_600_2000/0/1546088818884?e=2147483647&t=DIzoaSN0hxDHxRXjHPP6hJlqRBouuBhz5Vbucd7seQg&v=beta
    https://embed-ssl.wistia.com/deliveries/a17b301260d7da2b75e194f4fafa387b.webp?image_crop_resized=1280x720

    4

    Automation AreaProductivity Gain
    Repetitive TasksUp to 90% time reduction
    Report GenerationMinutes instead of hours
    Data CleaningFully automated processes

    Even basic automation can save 100+ working hours per year for a single professional.
    To understand how automation and MIS reporting are structured in detail, you can review the full course outline here:
    Excel Mastery Course


    Handling Large and Complex Data Sets

    Many professionals struggle with large Excel files. This Excel Mastery Course teaches efficient methods to manage and analyze heavy datasets without slowing down.

    SkillReal-World Impact
    Advanced FilteringFaster insights
    Data Cleaning TechniquesReliable reports
    Error HandlingMinimal rework

    Companies lose significant productivity due to poor data handling. Structured Excel workflows dramatically reduce this loss.


    Why This Excel Mastery Course Matters for Your Career

    Excel Skills Are Tested in Interviews

    Recruitment studies show that 7 out of 10 employers test Excel skills during interviews for MIS, finance, and analyst roles.

    Faster Career Growth

    Professionals who can independently manage reports, dashboards, and automation are often promoted faster due to their reliability and efficiency.

    Reduced Dependency

    Excel mastery reduces dependence on IT teams and external tools for routine data tasks.

    Freelancing and Side Income

    Advanced Excel professionals often earn additional income by creating dashboards, automating reports, or offering MIS consulting services.

    If you are serious about upgrading your Excel skills for long-term career growth, this complete Excel Mastery Course can be accessed here:
    Check Here


    What Makes This Excel Mastery Course Different?

    This Excel Mastery Course stands out because it focuses on:

    • Real corporate use cases
    • Practical assignments
    • Professional MIS formats
    • Automation-driven efficiency
    • Step-by-step progression from basics to advanced

    The learning approach ensures that skills are immediately applicable in real job environments.


    Learning Outcomes You Can Expect

    After completing this Excel Mastery Course, learners typically experience:

    • Faster report preparation
    • Improved data accuracy
    • Confidence in management reporting
    • Ability to automate daily tasks
    • Strong professional recognition

    Many learners report productivity improvements of 2x to 3x within weeks of applying these skills.


    Frequently Asked Questions (FAQ)

    What makes this an Excel Mastery Course instead of a basic Excel course?

    This Excel Mastery Course focuses on MIS reporting, automation, dashboards, and VBA rather than only basic spreadsheet features.

    Is this Excel Mastery Course suitable for beginners?

    Yes. The course starts from core fundamentals and gradually moves to advanced professional concepts.

    Will this Excel Mastery Course help with MIS and reporting jobs?

    Yes. MIS reporting is one of the main focuses of this Excel Mastery Course.

    Does the course include practical exercises?

    Yes. Real-world datasets and business-style assignments are used throughout.

    Is VBA difficult for non-technical learners?

    No. VBA is taught in a simple, step-by-step manner focused on business automation.

    Can this Excel Mastery Course help in salary growth?

    Professionals with advanced Excel skills often experience faster promotions and better salary increments.

    Is this Excel Mastery Course useful outside accounting and MIS roles?

    Yes. Excel mastery is valuable across finance, operations, sales, HR, and analytics roles.


    Conclusion: Why Excel Mastery Is a Smart Investment

    Excel is more than software—it is a career accelerator. A well-structured Excel Mastery Course equips you with skills that improve accuracy, efficiency, and professional value. In a competitive job market, strong Excel capabilities often become the deciding factor between average performance and career growth.


    Disclaimer

    This article is intended for educational and informational purposes only. Individual results may vary depending on effort, practice, and professional background. This content does not guarantee employment or salary increases but aims to enhance practical Excel proficiency.



  • Free Excel Course on Skillshare – Master Excel 365, 2019 & 2021 from Scratch to Pro

    Are you ready to transform your Excel skills and boost your career opportunities? Whether you’re a student, job-seeker, professional, or entrepreneur, mastering Excel is no longer optional—it’s essential.

    With the right training, Excel becomes more than just a spreadsheet tool. It becomes your data powerhouse—helping you analyze trends, build reports, automate tasks, and make data-driven decisions like top professionals do.

    That’s exactly what you’ll achieve with my Skillshare course:
    👉 Master Excel Like a Pro – From Scratch to Expert Level (Free with Skillshare 1-Month Trial).


    Why This Excel Course?

    This course is designed for real-world learning, not just theory. Every lesson is structured around practical business cases, hands-on exercises, and time-saving tricks that professionals use daily.

    You’ll start with the basics of Excel and progress step by step to advanced features—ending with the ability to build professional dashboards, automate tasks, and confidently tackle any data challenge.


    ✅ What You’ll Learn

    Here’s a quick overview of what’s inside the course:

    • Excel Interface & Navigation – Customize ribbons, quick access toolbar, and set up your workspace.
    • Data Entry & Formatting – Organize and present data professionally with formatting tools.
    • Math & Logical Functions – Automate decisions with IF, AND, OR, XOR, and nested formulas.
    • Text Functions – Clean and manipulate data using LEFT, RIGHT, MID, TRIM, FIND, SUBSTITUTE, etc.
    • Lookup & Reference Functions – Master VLOOKUP, HLOOKUP, INDEX-MATCH, and the game-changing XLOOKUP.
    • Data Protection & Printing – Secure your workbooks and prepare clean, professional printouts.
    • Data Analysis Tools – Use Conditional Formatting, Goal Seek, Scenario Manager, and What-If Analysis.
    • Charts & Visualization – Create stunning charts and advanced data visualizations.
    • PivotTables & Power Pivot – Analyze massive datasets with ease.
    • Macros & Automation – Record and manage macros to save time on repetitive tasks.

    🎯 Hands-On Projects

    Theory is important, but practice makes perfect.
    That’s why every section of the course includes tasks, case studies, or projects to ensure you apply what you learn immediately.

    By the end, you’ll have built Excel solutions that reflect real business reporting scenarios—giving you the confidence to use Excel professionally.


    📊 Who This Course Is For

    This course is perfect for:

    ✔ Beginners who want a solid foundation in Excel
    ✔ Working professionals managing reports, analytics, or office data
    ✔ Students preparing for exams or job interviews
    ✔ Freelancers & entrepreneurs managing their own data
    ✔ Accountants, analysts, HR, managers, and marketers who rely on Excel daily


    🎓 Course Details

    • 75 Lessons
    • 10 Hours 51 Minutes of Training
    • Available on Skillshare with a Free 1-Month Trial

    👉 Enroll here: Master Excel Like a Pro – From Scratch to Expert Level


    🚀 Why Learn Excel Today?

    In 2025, Excel remains the most in-demand skill across industries. Employers value professionals who can handle, analyze, and present data effectively. Whether you want to get hired, promoted, or start your own business, Excel proficiency will set you apart.

    This course is your one-stop solution to learning Excel 365 (also fully compatible with 2019 & 2021).


    💡 Final Words

    Don’t just learn Excel—master it. With hands-on projects, real-world examples, and clear step-by-step lessons, this Skillshare course will take you from beginner to expert in less than 11 hours.

    👉 Start learning today for FREE with Skillshare’s 1-Month Trial:
    Click here to enroll now


    📌 Disclaimer: This course is hosted on Skillshare. You can access it free for 1 month through the referral link above. After the trial, a Skillshare subscription may apply.


  • What is an Excel Dashboard? Importance, Career Scope & How to Learn It in 25 Days

    📊 What is a Dashboard in Excel?

    An Excel Dashboard is a visual and interactive summary of key data used to monitor performance, track KPIs, and make informed decisions. It combines charts, tables, metrics, and slicers on a single screen to present complex data in a clear and actionable format.

    Think of it as the control panel of your data – where decision-makers can quickly get answers without digging into raw spreadsheets.


    ✅ Key Elements of a Good Excel Dashboard:

    • Clean and well-prepared data sources
    • Use of PivotTables and formulas (SUMIFS, INDEX-MATCH, etc.)
    • Interactive elements like Slicers, Drop-downs, and Form Controls
    • Charts (Bar, Line, Combo, etc.) for visual storytelling
    • Focused on key metrics (KPI-focused)

    💡 Why Excel Dashboards Are Important

    1. Fast Decision-Making: Present trends and insights in seconds
    2. Time-Saving: Automates reports that would take hours to compile
    3. Customizable & Interactive: Tailored to specific teams—sales, HR, finance, etc.
    4. Widely Used Tool: Excel is available in almost every organization worldwide
    5. No Need for Expensive Tools: Dashboards in Excel offer business intelligence without needing Power BI or Tableau (for small to medium needs)

    👩‍💼 Career Impact of Mastering Excel Dashboards

    📈 Huge Demand Across Industries:
    Excel dashboards are used in marketing, sales, finance, HR, operations, and more.

    💼 Boost Your Resume & Job Role:
    Proficiency in dashboards is a top skill recruiters look for in analysts, managers, and administrators.

    💵 Higher Earning Potential:
    Professionals with Excel dashboard and data analysis skills command higher salaries and are often first in line for promotions.

    🌐 Freelancing & Consulting Opportunities:
    Many small businesses need dashboard creators but can’t afford BI tools. Your skill can become a paid gig or side hustle.


    ✅ Excel Dashboard Mastery: 25-Day Learning Plan

    📅 WEEK 1: Excel Foundations & Data Basics

    Goal: Strengthen core Excel skills and data understanding

    DayTopic
    Day 1✅ Introduction to Dashboards 📌 What makes a good dashboard, types (KPI, analytical, strategic)
    Day 2✅ Excel Interface & Shortcuts 📌 Ribbons, ranges, tables, navigation
    Day 3✅ Data Cleaning Basics 📌 Remove blanks, duplicates, trim, text-to-columns
    Day 4✅ Data Types & Formatting 📌 Numbers, dates, text formatting, custom formats
    Day 5✅ Excel Tables & Structured References 📌 Convert data into tables, advantages
    Day 6✅ Named Ranges & Cell Referencing 📌 Absolute vs relative references
    Day 7🔁 Practice Day 📌 Data cleanup & prep challenges

    📅 WEEK 2: Data Analysis & Functions

    Goal: Master formulas essential for dashboards

    DayTopic
    Day 8✅ Lookup Functions 📌 VLOOKUP, HLOOKUP, INDEX-MATCH
    Day 9✅ Logical Functions 📌 IF, IFS, AND, OR
    Day 10✅ Text Functions 📌 LEFT, RIGHT, MID, TEXTJOIN, TEXT
    Day 11✅ Date & Time Functions 📌 TODAY, MONTH, NETWORKDAYS
    Day 12✅ COUNTIFS, SUMIFS, AVERAGEIFS 📌 Conditional calculations
    Day 13✅ Sorting, Filtering & Advanced Filters
    Day 14🔁 Practice Day 📌 Create a mini report using all formulas learned

    📅 WEEK 3: Pivot Tables, Charts & Data Modeling

    Goal: Learn core visual & analysis tools

    DayTopic
    Day 15✅ Pivot Tables Basics 📌 Summarize & group data
    Day 16✅ Pivot Charts & Slicers 📌 Visual summary + interactivity
    Day 17✅ Chart Types in Excel 📌 Column, Line, Bar, Pie, Combo
    Day 18✅ Advanced Charts 📌 Gauge, Bullet, Thermometer, Gantt
    Day 19✅ Data Model & Power Pivot (Basics)
    Day 20🔁 Chart Building Practice Day 📌 Build 5 different charts

    📅 WEEK 4: Interactivity, Design & Final Dashboards

    Goal: Learn how to create complete, professional dashboards

    DayTopic
    Day 21✅ Data Validation & Drop-downs
    Day 22✅ Form Controls (Sliders, Checkboxes) & Conditional Formatting
    Day 23✅ Dashboard Design Principles 📌 Layout, color, user experience
    Day 24✅ Create a Full Interactive Dashboard 📌 With slicers, charts, KPIs
    Day 25✅ Capstone Project + Review 📌 Create your own business dashboard from scratch

    🔧 Tools & Skills You’ll Use:

    • Excel Tables & PivotTables
    • Dynamic Named Ranges
    • Formulas: IF, VLOOKUP, INDEX/MATCH, SUMIFS
    • Charts: Column, Line, Combo, Gauge
    • Form Controls: Buttons, Sliders
    • Conditional Formatting
    • Slicers, Timelines
    • Power Query (basic if time permits)

    📘 Suggested Practice Projects:

    • ✅ Sales Dashboard (weekly trends, region-wise sales)
    • ✅ HR Dashboard (employee attrition, hiring, headcount)
    • ✅ Financial Dashboard (profit/loss, KPIs, forecasts)
    • ✅ Inventory Dashboard (stock, reorder levels, category-wise)

    ✅ Tips to Stay on Track:

    • Practice daily, not just watching videos
    • Use real or sample business datasets
    • Keep dashboards simple, functional, and visually clean
    • Review your own dashboards critically (What’s missing? Is it user-friendly?)

    🎓 Want to Learn Faster and Smarter?


    If you’re serious about mastering Excel—not just for dashboards, but from the ground up—you’ll love this course:

    🚀 Microsoft Excel 365 – From Beginner to Advanced | Unleash Your Excel Potential

    ✅ Master Excel 365 – From Novice to Pro
    📚 11.5 hours of real-world training, hands-on walkthroughs, downloadable files, and lifetime access

    Whether you’re brushing up your skills or starting from scratch, this course will guide you through data entry to automation—helping you become job-ready, data-savvy, and confident in Excel.