Mastering financial modeling is essential for anyone looking to work in finance, business analysis, or consulting. This step-by-step Excel tutorial walks you through the complete process of building a fully integrated financial model from scratch. You’ll learn to forecast revenues, build dynamic Profit & Loss statements, Balance Sheets, and Cash Flow statements, and perform valuation analysis using DCF and ratio analysis. Whether you’re a beginner or a professional looking to refine your skills, this tutorial gives you a practical and structured approach using Excel’s most powerful functions and techniques.
💼 Financial Modeling in Excel – Step-by-Step Tutorial
1. Introduction to the Exercise
Understand the objectives of financial modeling:
- Forecast business performance
- Analyze profitability, liquidity, solvency
- Build an integrated model: P&L, Balance Sheet, Cash Flow
You’ll work with:
- Historical financial data (3–5 years)
- Forecast assumptions
- Dynamic Excel functions
2. Mapping the Financials
Create a mapping sheet to classify raw data into categories like:
- Revenue
- COGS
- Operating Expenses
- Assets
- Liabilities
Example:
=IF(A2="Sales","Revenue",IF(A2="Interest Income","Other Income",""))
Use this mapping to structure output statements.
3. Build the Output Profit & Loss (P&L) Sheet
Create a clean summary for P&L:
- Rows: Revenue, COGS, Gross Profit, OPEX, EBITDA, Net Profit
- Columns: Historical and forecast years
Link each line item to mapped categories using SUMIF, INDEX, or MATCH.
4. Populate Historical Financials in Output P&L
Pull values from raw input sheets:
- Use
SUMIFS,INDEX-MATCH, or structured references from Power Query outputs.
Ensure accuracy by cross-verifying totals.
5. Calculate Percentage Variance and Add Conditional Formatting
Calculate YoY variance:
=(CurrentYear - PreviousYear)/PreviousYear
Add conditional formatting:
- Green for growth
- Red for decline
Improves visual storytelling in reports.
6. Build the Output Balance Sheet
Sections:
- Assets: Current (Cash, AR, Inventory), Non-current (PP&E)
- Liabilities: Current (AP), Long-term (Loans)
- Equity: Share Capital, Retained Earnings
Follow the accounting equation:
Assets = Liabilities + Equity
7. Use INDEX-MATCH-MATCH for Balance Sheet Lookup
For structured and scalable lookup:
=INDEX(Data!$B$2:$G$100, MATCH("Inventory", Data!$A$2:$A$100, 0), MATCH("2023", Data!$B$1:$G$1, 0))
This allows flexible, multi-year access.
8. Add Forecast Period Columns
Extend your model with forecast years (e.g., FY24E to FY26E).
Forecast revenue:
=LastYearRevenue*(1 + AssumedGrowthRate)
Apply same for cost and other variables using drivers.
9. Calculate Ratios Using OFFSET and MATCH
Use ratios to analyze trends and build assumptions:
- Gross Margin, OPEX %, Net Margin
- DSO, DPO, DIO, etc.
Example:
=OFFSET(P&L!C5,0,1)/OFFSET(P&L!C5,0,0)
MATCH dynamically selects year/period.
10. Build Flexible Models with CHOOSE and MATCH
For scenario-based models:
=CHOOSE(MATCH(Scenario, {"Base","Best","Worst"}, 0), BaseGrowth, BestGrowth, WorstGrowth)
Useful for executive decision-making.
11. Use VLOOKUP and COLUMNS for Dynamic Scenarios
Another way to automate scenario modeling:
=VLOOKUP("Revenue", ScenarioSheet!$A$2:$D$10, COLUMNS($A:A)+1, FALSE)
Each scenario (Base, Best, Worst) in separate columns.
12. Calculate Historical Working Capital Ratios
Key ratios:
- DSO = (Accounts Receivable / Revenue) * 365
- DPO = (Accounts Payable / COGS) * 365
- DIO = (Inventory / COGS) * 365
- Other Assets % = Other Assets / Revenue
Helps in building accurate cash flow and net working capital forecasts.
13. Forecast Working Capital Items
Use historical averages or policy targets to forecast:
- DSO, DPO, DIO
- Other Assets & Liabilities as % of Revenue
Apply to forecast Balance Sheet and cash flow needs.
14. Build a Fixed Asset Roll Forward
Track the PP&E movement:
Opening Balance
+ Additions
– Disposals
– Depreciation
= Closing Balance
Automate using rows and formulas across forecast years.
15. Build the Financial Liabilities Schedule
Track debt repayments and interest:
- Opening Balance
- Additions
- Principal Repayments
- Interest Expense
Create an amortization table using formulas:
=IF(Year<=MaturityYear, PreviousBalance – Repayment, 0)
16. Build the Equity Schedule
Track:
- Issued capital
- Retained earnings (link to Net Profit)
- Dividends
Formula:
=LastYearRetainedEarnings + NetProfit – Dividends
Ensure this flows into Balance Sheet and matches accounting identity.
17. Prepare the Cash Flow Statement
Break into sections:
- Operating: Net Profit + adjustments
- Investing: Capex, asset sales
- Financing: Loans, repayments, dividends
Start from Net Profit and adjust:
=Net Profit + Depreciation – Capex ± Working Capital Changes ± Financing
18. Calculate Final Cash Flows & Validate Model
Link ending cash from cash flow to Balance Sheet.
- Ensure:
Opening Cash + Net Cash Flow = Closing Cash
Use a balance check:
=IF(Assets = Liabilities + Equity, "Balanced", "Error")
✅ Final Output
You now have a:
- Fully integrated 3-statement model
- Scenario-based forecasting tool
- Financial ratio analyzer
- Decision-making dashboard
Top rated products
-

Apple iPhone 17 (256GB Storage, Black)
-
MS Access Mastery Training in Hindi: Unleashing Data Potential
Original price was: ₹1,299.00.₹1,249.00Current price is: ₹1,249.00. -

Kama Ayurveda: Luxury Ayurvedic Skincare & Wellness
-
Excel VBA/Macro Masterclass: Automate Excel, Boost Productivity : Classroom /Live Class Training
Original price was: ₹8,500.00.₹6,500.00Current price is: ₹6,500.00. -
Little Monk Buddha Statue Set
Original price was: ₹1,299.00.₹134.00Current price is: ₹134.00. -

Master Excel, Access, Macros & SQL – All in One Course
-
Google Calendar Mastery Training: Learn to Streamline Your Schedule in Just 1 Hour
Original price was: ₹999.00.₹949.00Current price is: ₹949.00. -

Mark & Mia Woven Sleeveless Party Frock – Navy Blue
-
Mastering MS Excel (Pen Drive Course) – Learn Excel Anytime, Anywhere
Original price was: ₹4,999.00.₹1,299.00Current price is: ₹1,299.00. -

Best Ergonomic Gaming & Computer Chair
-
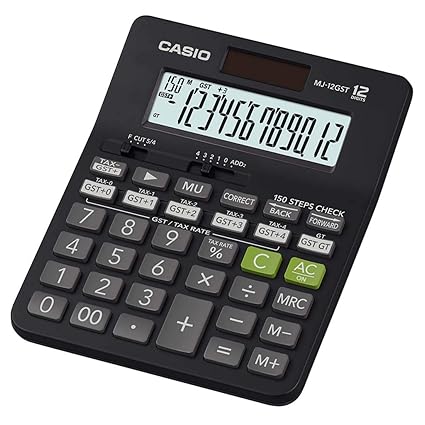
Casio MJ-12GST GST Calculator
-
Google Drive Mastery: Learn to Streamline Your Digital Workspace in 27 Minutes
Original price was: ₹999.00.₹949.00Current price is: ₹949.00.