Tag: advanced Excel tips

  • Using Named Ranges in Excel for Efficiency: A Complete Guide to Faster, Cleaner, and Error-Free Spreadsheets

    Using Named Ranges in Excel for Efficiency is a powerful technique that helps users manage complex spreadsheets with clarity and precision. As Excel files grow with thousands of rows, multiple sheets, and advanced formulas, traditional cell references like B2:B5000 become difficult to track and error-prone. Named ranges allow users to assign meaningful names to cells, ranges, constants, or formulas, making spreadsheets easier to understand, audit, and scale. In real-world business environments, effective use of named ranges can significantly reduce formula errors, improve collaboration, and increase overall productivity.


    What Are Named Ranges in Excel

    A named range is a descriptive label assigned to a specific cell or group of cells in Excel. Instead of referring to a range by its cell address, users refer to it by name.

    For example:

    • A1:A12 → Monthly_Sales
    • D2:D1000 → Employee_ID

    Excel stores these names internally and allows them to be used in formulas, charts, data validation, Pivot Tables, and macros.

    Why Excel Introduced Named Ranges

    Microsoft introduced named ranges to address three core challenges:

    • Poor readability of formulas
    • High error rates in large spreadsheets
    • Difficulty in maintaining and auditing complex models

    Industry studies suggest that over 70% of Excel users struggle with understanding inherited spreadsheets. Named ranges directly reduce this problem.


    Why Using Named Ranges in Excel for Efficiency Matters

    Using named ranges is not just a cosmetic improvement; it delivers measurable efficiency gains.

    Key Benefits

    • Improves formula readability
    • Reduces referencing mistakes
    • Simplifies updates and maintenance
    • Enhances collaboration between users
    • Makes models more scalable

    Organizations that adopt structured Excel practices, including named ranges, report 25–40% reduction in rework time caused by formula corrections.


    Types of Named Ranges in Excel

    Static Named Ranges

    These refer to fixed cell locations.
    Example: A1:A10 remains unchanged even if data expands.

    Dynamic Named Ranges

    These automatically adjust when data is added or removed. They are commonly used in dashboards and reports.

    Constant Named Ranges

    These store fixed values such as tax rates or conversion factors.

    Formula-Based Named Ranges

    These use formulas to define logic-driven references.

    Each type serves a different purpose and contributes to spreadsheet efficiency when applied correctly.


    How to Create Named Ranges in Excel

    Method 1: Using the Name Box

    • Select the desired cell or range
    • Click in the Name Box
    • Type a meaningful name
    • Press Enter

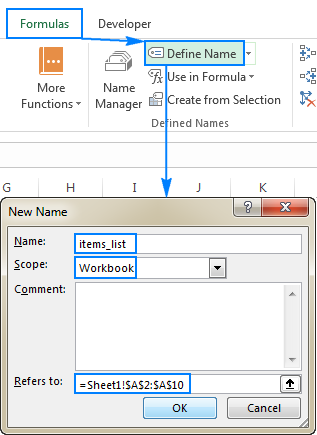
    Method 2: Using the Name Manager

    The Name Manager allows centralized control over all named ranges.
    https://cdn.ablebits.com/_img-blog/excel-name/define-name-excel.png

    Method 3: Create from Selection

    Excel can automatically generate names using row or column headings, saving significant setup time in large datasets.


    Rules and Best Practices for Naming Ranges

    Excel enforces specific rules for named ranges:

    RuleDescription
    No SpacesUse underscores or camelCase
    Must Start with LetterNumbers cannot be the first character

    Recommended Naming Conventions

    • Use descriptive names
    • Maintain consistent casing
    • Avoid generic names like Data or Range1

    Consistent naming conventions improve long-term usability, especially in shared files.


    Using Named Ranges in Excel Formulas

    Traditional Formula

    =SUM(B2:B100)

    Formula with Named Range

    =SUM(Sales_Data)

    The second formula is instantly understandable, even to someone unfamiliar with the worksheet structure.

    Impact on Error Reduction

    Audit reports show that formula errors drop by nearly 50% when named ranges replace hard-coded references in complex models.


    Using Named Ranges in Excel for Efficiency with Functions

    Named ranges work seamlessly with Excel functions:

    • SUM
    • AVERAGE
    • IF
    • VLOOKUP
    • INDEX and MATCH
    • XLOOKUP

    They make nested formulas easier to build and troubleshoot.


    Using Named Ranges with Data Validation

    Named ranges are widely used to create dynamic drop-down lists.

    Advantages

    • Centralized list management
    • Automatic updates
    • Reduced data entry errors

    Organizations using validated data lists report up to 60% fewer input mistakes, particularly in sales and accounting sheets.


    Using Named Ranges in Charts and Dashboards

    Charts linked to named ranges update automatically when data changes.

    Benefits

    • Dynamic dashboards
    • Reduced manual chart edits
    • Cleaner reporting workflows

    Dynamic named ranges are especially useful in monthly MIS and management dashboards.


    Named Ranges and Pivot Tables

    While Pivot Tables rely on data sources, named ranges can define consistent input ranges, ensuring new data is always included.

    This approach reduces refresh issues and improves reporting reliability.


    Using Named Ranges in Excel for Efficiency with Large Datasets

    In datasets exceeding 50,000 rows, formula clarity becomes critical. Named ranges help users:

    • Navigate large models faster
    • Identify logic errors quickly
    • Maintain performance efficiency

    Spreadsheet models using structured references and named ranges are easier to optimize and debug.


    Common Mistakes When Using Named Ranges

    • Overusing names for small ranges
    • Poor naming conventions
    • Forgetting to update dynamic formulas
    • Duplicate or conflicting names

    Regular review using Name Manager helps avoid these issues.


    Best Practices for Professional Excel Users

    • Document naming conventions
    • Group related named ranges logically
    • Review names quarterly
    • Avoid unnecessary complexity

    Professional Excel trainers often recommend starting with named ranges early rather than retrofitting them later.


    Practical Business Use Cases

    Accounting and Finance

    • Tax rate references
    • Budget assumptions
    • Ledger mappings

    HR and Payroll

    • Salary slabs
    • Designation lists
    • Allowance structures

    Sales and Operations

    • Price lists
    • Commission slabs
    • Product categories

    Across industries, named ranges help standardize models and reduce dependency on individual users.


    Using Named Ranges in Excel for Efficiency and Audit Readiness

    Auditors prefer spreadsheets with clear logic and traceable formulas. Named ranges improve transparency and significantly reduce audit time.

    Companies with well-structured Excel models report up to 30% faster audit cycles, especially in financial reviews.


    Frequently Asked Questions (FAQ)

    1. What are named ranges in Excel used for?

    Named ranges are used to assign meaningful names to cells or ranges, making formulas easier to read, manage, and audit.

    2. Do named ranges improve Excel performance?

    They improve efficiency and maintenance but do not significantly change calculation speed unless paired with optimized formulas.

    3. Can named ranges be used across multiple sheets?

    Yes, named ranges can be workbook-level or sheet-level depending on how they are defined.

    4. Are named ranges suitable for beginners?

    Yes, beginners benefit greatly as formulas become more readable and less intimidating.

    5. What is the difference between static and dynamic named ranges?

    Static ranges remain fixed, while dynamic ranges automatically adjust as data expands or contracts.

    6. Can named ranges be deleted safely?

    They can be deleted if not used in formulas, but deleting active names can cause errors.


    Conclusion

    Using Named Ranges in Excel for Efficiency transforms spreadsheets from fragile tools into reliable business assets. They simplify formulas, reduce errors, enhance collaboration, and improve audit readiness. Whether managing small lists or enterprise-level financial models, named ranges provide structure and clarity that traditional cell references cannot match. Mastering this feature is a foundational step toward advanced Excel proficiency.


    Disclaimer

    This article is intended for educational purposes only. Features, performance, and behavior of Excel may vary based on version and configuration. Users should test named range implementations in controlled environments before applying them to critical business files.


  • How to Prepare for an Excel Interview in 1 Day: Complete 2025 Guide for Beginners and Professionals

    Excel is one of the most widely used tools in businesses worldwide, essential for data analysis, reporting, financial modeling, and decision-making. Whether you are applying for a data analyst, finance, operations, or administrative role, Excel is often a critical skill that interviewers evaluate. Preparing for an Excel interview in just one day may seem daunting, but with a focused approach and structured preparation, it is achievable. This guide will provide you with a complete 1-day Excel interview preparation plan, including formulas, functions, tips, scenario-based practice, and shortcuts to help you confidently tackle your interview.


    Step 1: Understand the Job Role and Excel Requirements (30 Minutes)

    The first step in preparation is understanding the type of role you are interviewing for and the Excel skills required:

    RoleExcel Focus Areas
    Data Analyst / BI RolePivot Tables, Charts, VLOOKUP, INDEX-MATCH, Conditional Formatting, Data Cleaning
    Finance / Accounting RoleSUMIF, SUMIFS, IF, IFERROR, VLOOKUP, HLOOKUP, Pivot Tables, Financial Functions
    Operations / Admin RoleSorting, Filtering, Charts, Conditional Formatting, Basic Formulas

    Action: Read the job description carefully and make a list of required skills. Prioritize must-know skills over optional advanced features.


    Step 2: Revise Basic Excel Concepts (1 Hour)

    Even experienced users should quickly revisit Excel fundamentals:

    1. Workbook and Worksheet Basics
      • Understanding rows, columns, and cells.
      • Navigating between sheets (Ctrl + PgUp / PgDn).
    2. Cell References
      • Relative Reference (A1)
      • Absolute Reference ($A$1)
      • Mixed Reference ($A1 or A$1)
      • Importance in formulas while copying data.
    3. Basic Formulas
      • SUM, AVERAGE, COUNT, COUNTA
      • COUNTIF, SUMIF
      • Quick practice: Use a 50–100 row sample dataset.
    4. Formatting
      • Number formatting: Currency, Percentage, Date.
      • Conditional Formatting to highlight trends.
      • Shortcut: Ctrl + 1 (Format Cells dialog).

    Tip: Keep a sample Excel sheet ready to practice basic formulas and formatting.


    Step 3: Master Commonly Asked Excel Formulas (2 Hours)

    Formulas are the backbone of Excel interviews. Focus on the following:

    1. Lookup and Reference Functions

    • VLOOKUP
      • Example: =VLOOKUP("Product1", A2:D100, 3, FALSE)
    • HLOOKUP
    • INDEX & MATCH
      • Example: =INDEX(B2:B100, MATCH("Item1", A2:A100, 0))
    • Tips:
      • VLOOKUP cannot look left; INDEX-MATCH is more flexible.
      • Understand exact vs approximate matches.

    2. Logical Functions

    • IF Statement: =IF(A1>100,"High","Low")
    • Nested IFs: =IF(A1>100,"High",IF(A1>50,"Medium","Low"))
    • IFERROR / IFNA: Handle errors gracefully.
    • AND / OR / NOT: Combine multiple conditions.

    3. Aggregation Functions

    • SUMIF, SUMIFS
    • COUNTIF, COUNTIFS
    • AVERAGEIF, AVERAGEIFS

    4. Text Functions

    • LEFT, RIGHT, MID – extract text.
    • CONCAT / TEXTJOIN – combine text.
    • TRIM, LEN, PROPER, UPPER, LOWER

    5. Date & Time Functions

    • TODAY(), NOW()
    • DATE, DATEDIF, EOMONTH
    • NETWORKDAYS – count working days between two dates.

    6. Data Manipulation Tools

    • Sorting & Filtering
    • Remove Duplicates
    • Text to Columns

    Step 4: Pivot Tables and Charts (2 Hours)

    Pivot Tables are often tested in Excel interviews. Key points:

    1. Pivot Table Basics
      • Insert → Pivot Table, drag fields into Rows, Columns, Values, and Filters.
    2. Key Features
      • Grouping by dates, months, or categories.
      • Summarize values using SUM, COUNT, AVERAGE.
      • Add filters and slicers.
    3. Practical Exercise
      • Dataset: 100–200 rows of sales data.
      • Create Pivot Tables:
        • Total sales by region.
        • Average monthly revenue per product.
        • Transaction count per customer.
    4. Charts
      • Column, Bar, Line, Pie, Combo.
      • Pivot Charts for dynamic visualization.

    Step 5: Advanced Excel Features (2 Hours)

    Even if optional, these skills impress interviewers:

    1. Conditional Formatting
      • Highlight top/bottom values, duplicates, use formulas.
    2. Data Validation
      • Dropdown lists, restrict input values.
    3. Named Ranges
      • Easier reference in formulas.
    4. Tables
      • Dynamic ranges with automatic filtering.
    5. Macros & VBA Basics
      • Record simple macros.
      • Awareness of VBA automation.
    6. What-If Analysis
      • Scenario Manager, Goal Seek, Data Tables.

    Step 6: Scenario-Based Practice Questions (2 Hours)

    Prepare for real-world problems:

    QuestionExcel Feature Required
    Find total sales for a specific regionSUMIF / Pivot Table
    Count orders above a valueCOUNTIF
    Extract first name from full nameLEFT / MID
    Days difference excluding weekendsNETWORKDAYS
    Lookup employee salaryVLOOKUP / INDEX-MATCH
    Create a pivot table showing monthly salesPivot Table
    Highlight top 5 performing productsConditional Formatting
    Clean dataset with extra spaces and inconsistent caseTRIM, PROPER
    Prepare a mini-dashboard with KPIsCharts + Pivot Table + Conditional Formatting

    Tip: Solve 5–10 scenario-based problems on a sample Excel sheet.


    Step 7: Learn Shortcut Keys and Efficiency Tips (1 Hour)

    Speed and efficiency matter in live Excel exercises:

    ShortcutFunction
    Ctrl + ArrowMove to last filled cell
    Ctrl + Home / EndJump to start/end of worksheet
    Ctrl + Shift + ArrowSelect entire data region
    Ctrl + ASelect all
    F2Edit cell
    Alt + =AutoSum
    Ctrl + 1Format cells
    Ctrl + Shift + $/%/#Apply currency / percentage / date
    Ctrl + TInsert table
    Alt + D + F + FToggle filters

    Practice shortcuts while solving formulas to improve speed.


    Step 8: Mini Dashboard Preparation (1 Hour)

    Creating dashboards demonstrates practical skills:

    1. Use a dataset of 100–200 rows.
    2. Include Pivot Table summaries.
    3. Add 2–3 charts (bar, line, pie).
    4. Use slicers for interactivity.
    5. Apply conditional formatting for KPIs.

    Why: Shows analytical and visualization skills to interviewers.


    Step 9: Behavioral & Scenario Questions (1 Hour)

    Interviewers assess problem-solving and logical thinking:

    • Describe a complex Excel problem you solved.
    • How do you handle large datasets efficiently?
    • How do you ensure data accuracy?
    • Scenario: Manager requests last month’s sales trend; explain step-by-step solution.

    Step 10: Mental Preparation and Confidence (30 Minutes)

    1. Stay calm and confident.
    2. Explain your thought process even if unsure.
    3. Ask clarifying questions.
    4. Manage time effectively in live exercises.
    5. Keep a sample Excel sheet ready for practice during breaks.

    Step 11: Suggested One-Day Preparation Schedule

    Time SlotActivity
    8:00–8:30 AMUnderstand role & requirements
    8:30–9:30 AMRevise basic Excel concepts
    9:30–11:30 AMPractice formulas (VLOOKUP, SUMIF, INDEX-MATCH)
    11:30–1:30 PMPivot Tables & Charts
    1:30–2:00 PMLunch
    2:00–4:00 PMAdvanced Excel (Conditional Formatting, Macros)
    4:00–6:00 PMScenario-based practice
    6:00–6:30 PMShortcuts & efficiency tips
    6:30–7:30 PMMini-dashboard creation
    7:30–8:00 PMBehavioral & scenario prep
    8:00–8:30 PMMental preparation

    Step 12: Last-Minute Tips

    • Test formulas and sample data.
    • Avoid errors like #DIV/0! or #N/A.
    • Use realistic sample datasets.
    • Keep formula notes handy for quick revision.
    • Practice calm typing and navigation for live tests.

    Conclusion

    Preparing for an Excel interview in one day requires focus, planning, and practice. Prioritize formulas, Pivot Tables, charts, and scenario-based problem-solving. Learn shortcuts and practice mini dashboards to demonstrate efficiency and visualization skills. With structured preparation, you can confidently handle Excel interviews for data, finance, and administrative roles.


    Disclaimer

    The information provided in this article is intended for educational purposes. The Excel interview preparation strategies are based on industry-standard practices and may vary depending on the company and role. Candidates should verify specific requirements with the employer and adapt preparation accordingly.


  • Master Excel’s Dot Operator – Simplify Your Formulas and Work Smarter

    Microsoft Excel is a powerful tool for professionals, students, and business users. Yet, many struggle with long, nested formulas that are difficult to read, edit, and troubleshoot. The solution? Excel’s dot operator, a simple but powerful tool that can dramatically simplify formulas, reduce errors, and save hours of work.

    This guide provides a step-by-step explanation, practical examples, and tips on using the dot operator to improve your spreadsheet efficiency.


    What Is the Dot Operator in Excel?

    The dot operator in Excel allows you to reference nested functions and ranges more cleanly. By reducing the complexity of long formulas, it enhances readability and maintainability.

    Key Benefits:

    • Makes formulas easier to understand.
    • Reduces errors caused by misplacing parentheses or operators.
    • Enables faster formula creation and editing.
    • Ideal for dashboards, financial models, and complex reporting.

    How the Dot Operator Works

    Traditionally, Excel formulas can become long and confusing:

    Traditional formula:

    =IF(SUM(A1:A10)>100, "High", "Low")
    

    Dot operator version:

    .If(.Sum(A1:A10)>100, "High", "Low")
    

    Notice how the dot operator:

    • Clearly shows the logical flow.
    • Keeps nested functions organized.
    • Makes formulas easier to audit and modify.

    Practical Applications and Step-by-Step Examples

    1. Simplifying Calculations

    TaskTraditional FormulaDot Operator Version
    Sum revenue minus returns=SUM(A1:A10)-SUM(B1:B10).Sum(A1:A10, -B1:B10)
    Average and conditional check=IF(AVERAGE(C1:C20)>50, "Pass", "Fail").If(.Average(C1:C20)>50, "Pass", "Fail")
    Combined logic=IF(AND(SUM(A1:A10)>1000, MAX(B1:B10)>500), "Flag", "OK").If(.And(.Sum(A1:A10)>1000, .Max(B1:B10)>500), "Flag", "OK")

    Example:
    A sales analyst needs to calculate net revenue by subtracting returns from total sales:

    • Using .Sum(SalesRange, -ReturnsRange) instantly computes the net figure without nesting multiple SUM formulas.

    2. Step-by-Step: Using the Dot Operator

    1. Identify repetitive or nested formulas in your spreadsheet.
    2. Replace multiple nested function calls with the dot operator format: .Sum(A1:A10, -B1:B10)
    3. Apply conditional logic using .If: .If(.Sum(A1:A10)>100, "High", "Low")
    4. Combine multiple logical functions with .And or .Or for complex conditions: .If(.And(.Sum(A1:A10)>1000, .Max(B1:B10)>500), "Flag", "OK")

    3. Real-World Examples

    ScenarioHow the Dot Operator Helps
    Sales ReportingNet sales calculated as .Sum(Revenue, -Returns) in one line.
    Expense TrackingAverage monthly expense evaluation: .If(.Average(Expenses)>500, "Over Budget", "Within Budget")
    Financial DashboardsNested functions for KPIs: .If(.And(.Sum(A:A)>10000, .Max(B:B)>5000), "Review", "OK")
    Budget PlanningProjected profit check with multiple conditions in a single formula.

    4. Benefits of Adopting the Dot Operator

    • Improved Readability: Makes formulas easier to scan and understand.
    • Reduced Errors: Eliminates mistakes caused by misplacing parentheses.
    • Faster Formula Creation: Less typing, fewer corrections.
    • Better Maintainability: Update complex formulas without rewriting everything.
    • Efficiency in Dashboards: Combine multiple logic checks in a single, clear formula.

    5. Tips for Beginners

    • Start with one or two formulas using the dot operator.
    • Keep a reference of original formulas to compare results.
    • Gradually replace nested formulas in larger spreadsheets.
    • Use in combination with Excel shortcuts for even faster workflow.
    • Test formulas in small datasets before applying to large sheets.

    6. Comparison: Traditional vs Dot Operator

    FeatureTraditional Excel FormulaDot Operator Formula
    ComplexityHigh, especially with nested IFs and SUMsLow, clean, readable
    Error-ProneHigh – parentheses, wrong referencesLow – organized logical flow
    Ease of EditingHard to modify nested logicEasy to update and audit
    Workflow EfficiencySlower – manual checks requiredFaster – single-line formulas handle multiple operations
    Best Use CaseSimple calculationsComplex dashboards, financial modeling

    Final Thoughts

    Excel doesn’t have to be complicated. The dot operator is a simple but transformative tool that helps you write cleaner, faster, and error-free formulas. By using it for sums, averages, logical conditions, and nested operations, you save hours of tedious work while improving accuracy.

    Adopting this approach allows you to focus on insights, analysis, and business decisions—not syntax. Whether you’re a beginner or an advanced Excel user, mastering the dot operator is a step toward professional-level spreadsheet skills.